Join Our Telegram channel to stay up to date on breaking news coverage
Bitcoin (BTC) Price Prediction – March 9
As the daily chart reveals, Bitcoin is trading near the resistance level of $55,000 as the recovery comes slowly.
BTC/USD Long-term Trend: Bearish (Daily Chart)
Key levels:
Resistance Levels: $60,000, $62,000, $64,000
Support Levels: $47,000, $45,000, $43,000

At the time of writing, BTC/USD is seen trading at $54,607 after soaring to $54,819 in the early hour of today’s trading. The first digital asset is also seen pulling back to where it is currently trading and may likely head downwards if the bears step back into the market.
What to Expect from Bitcoin (BTC)
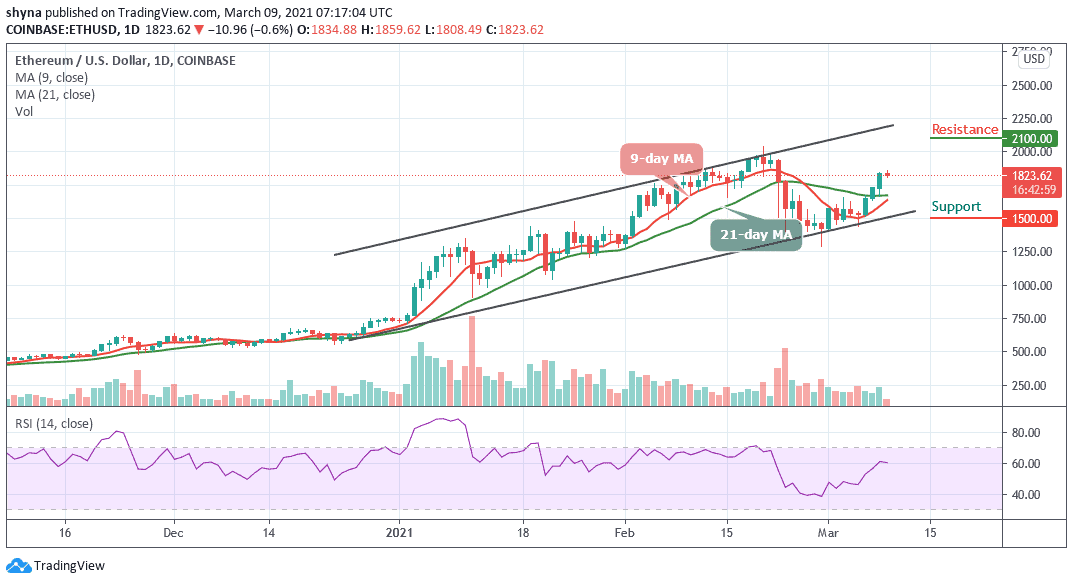
On the bullish side, it is important for bulls to remains above the 9-day and 21-day moving averages, otherwise, there may come a bearish breakdown when BTCUSD falls below that barrier. The 9-day MA is about to cross above the 21-day MA as the technical indicator RSI (14) is sending moderate signs where an oscillation to the higher boundary may confirm the proper trend which is more likely a bullish trend at the time of the outcome.
However, BTC/USD will confirm the bullish trend if the market price moves above the previous high of $58,000. Meanwhile, the Bitcoin price may follow the bearish trend if the price moves below the moving averages and cross below the lower boundary of the channel. Should this happen, the king coin may drop to the critical supports of $47,000, $45,000, and $43,000. As the technical indicator RSI (14) moves above 65-level, a strong bullish spike may push the price towards the resistance levels of $60,000, $62,000, and $64,000.
BTC/USD Medium-Term Trend: Bullish (4H Chart)
According to the 4-hour chart, BTC is looking bullish as the market is following a bullish trend. However, the intraday trading is still looking bullish; following the recent rebound at $53,553 which is now a key support level. The next key support levels are $52,000 and below.
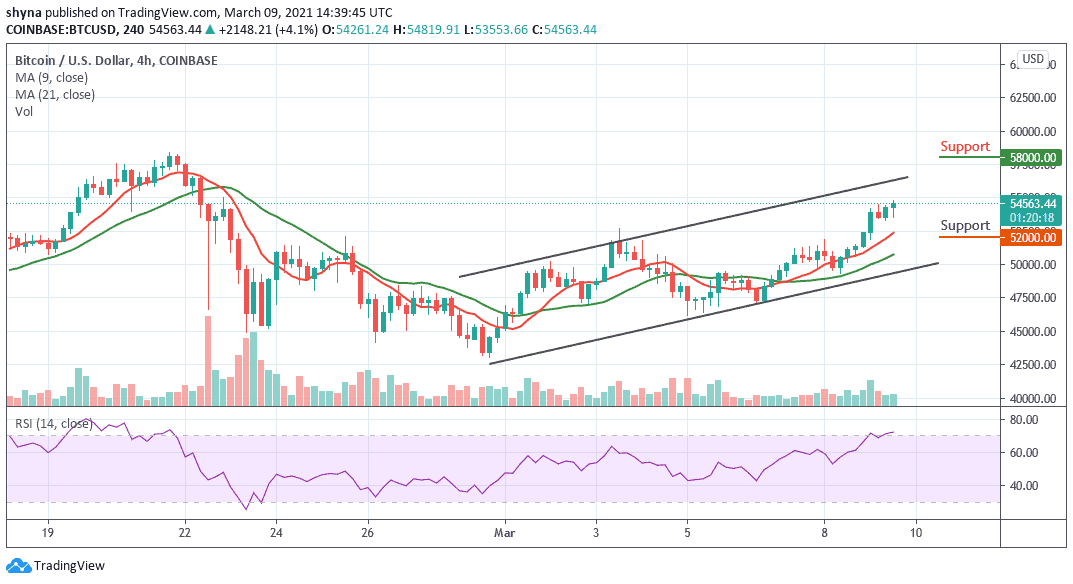
However, considering the recent sharp rebound, the Bitcoin price may continue the bullish rally to $55,000 resistance. A climb above this level may further push BTC price to the resistance level of $58,000 and above. As it looks now, bulls are returning into the market gradually as the technical indicator RSI (14) moves into the overbought zone.
Join Our Telegram channel to stay up to date on breaking news coverage