
Join Our Telegram channel to stay up to date on breaking news coverage
The Bitcoin price prediction reveals that BTC is yet to gain strength above the moving averages as the coin shows a few bearish signs.
Bitcoin Prediction Statistics Data:
- Bitcoin price now – $19,106
- Bitcoin market cap – $366.1 billion
- Bitcoin circulating supply – 19.1 million
- Bitcoin total supply – 19.1 million
- Bitcoin Coinmarketcap ranking – #1
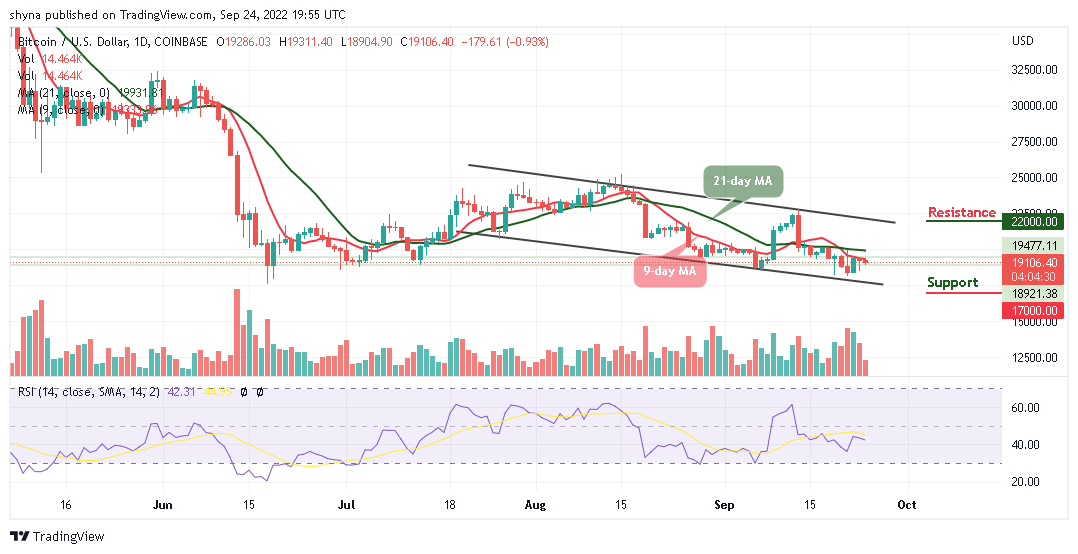
BTC/USD Long-term Trend: Bearish (Daily Chart)
Key levels:
Resistance Levels: $22,000, $24,000, $26,000
Support Levels: $17,000, $15,000, $13,000
Your capital is at risk
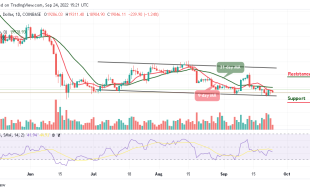
After another failure to stay above the $19,300 level; BTC/USD remains below the 9-day and 21-day moving averages. The Bitcoin price could begin another decline if bulls failed to push it above the moving averages. At the opening of today’s trading; the coin touches the resistance level of $19,311, but any further bearish movement may keep the coin within the bearish zone.
Bitcoin (BTC) Heads to Downside as OKX lists Tamadoge (TAMA)
As the Bitcoin price hovers below the 9-day and 21-day moving averages, moving towards the lower boundary of the channel may begin to show bearish signs below the $19,000 level. More so, if there are more losses, the price could break the major supports at $17,000, $15,000, and $13,000. Meanwhile, the technical indicator Relative Strength Index (14) moves to cross below the 40-level to increase the bearish movement.
On the other hand, if the king coin crosses above the 9-day and 21-day moving averages; it could begin a bullish movement. Moreover, the nearest resistance could be located around the $20,000 level and a clear break above this level may push the price towards the resistance levels of $22,000, $24,000, and $26,000.
BTC/USD Medium-term Trend: Ranging (4H Chart)
According to the 4-hour chart, the coin may gain lost momentum if the coin break above the upper boundary of the channel, but at the moment, the volatility still hovers, and the selling pressure exists, which could lead the coin to the downside. Meanwhile, the $18,000 and below may come into play if BTC heads toward the lower boundary of the channel.
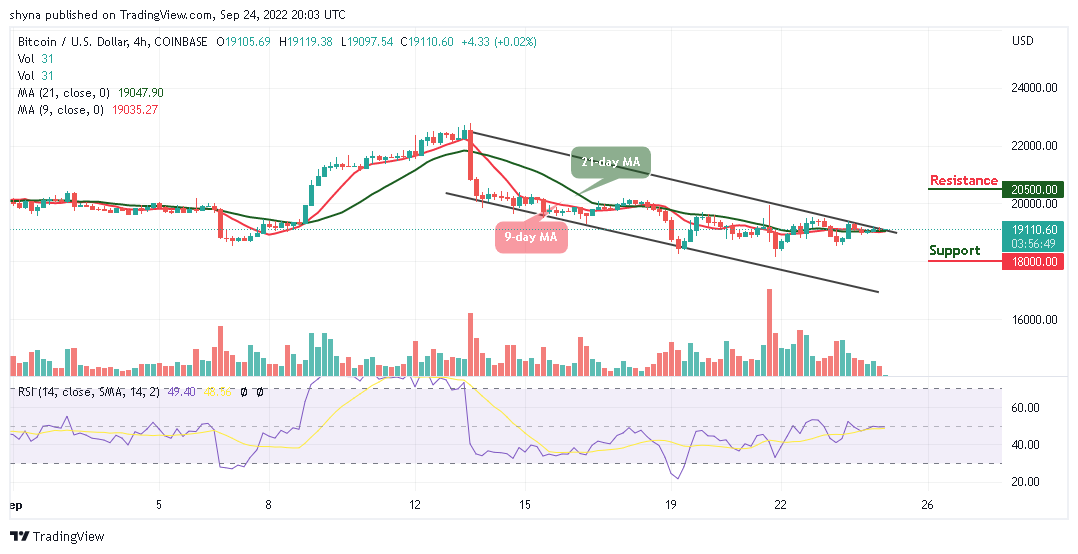
However, if the buyers can reinforce and power the market, traders can expect a retest of the $19,119 resistance level, breaking this level may further allow the bulls to reach the resistance level of $20,500 and above. The Relative Strength Index (14) is moving around the 50-level, which shows that the market may begin to move sideways.
Join Our Telegram channel to stay up to date on breaking news coverage