Join Our Telegram channel to stay up to date on breaking news coverage
The Solana price prediction reveals that SOL may head to the downside as the dip is likely to get worse if it crosses to the negative side.
Solana Prediction Statistics Data:
- Solana price now – $33.72
- Solana market cap – $11.9 billion
- Solana circulating supply – 354.6 million
- Solana total supply – 511.6 million
- Solana Coinmarketcap ranking – #9
SOL/USD Market
Key Levels:
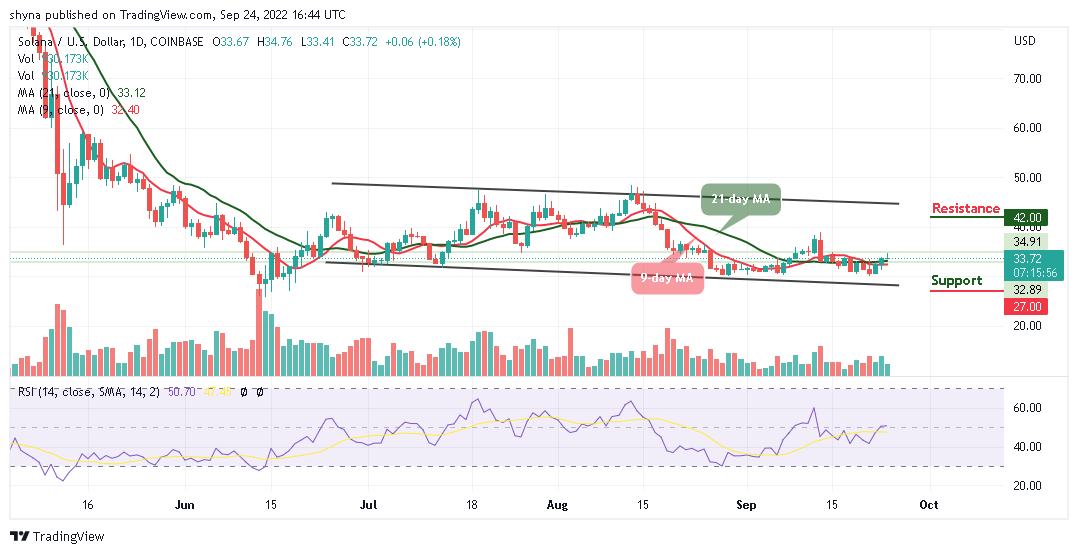
Resistance levels: $42, $44, $46
Support levels: $27, $25, $23
Your capital is at risk
SOL/USD may not be able to follow the bullish movement as the coin may cross below the 9-day and 21-day moving averages. The Solana price is currently trading at $33.72, sliding from the high of $34.76 to face the downside at the time of writing.
Solana My Head to the Downside, Tamadoge Debuts on OKX
Looking at the daily chart, the Solana price may begin to move sideways but any bearish movement below the 9-day and 21-day moving averages may welcome the sellers back into the market while the critical supports could come at $27, $25, and $23. Meanwhile, any buyer movement towards the upper boundary of the channel may reach the next resistance levels at $42, $44, and $46.
However, the technical indicator could start a new bearish session as the Relative Strength Index (14) remains within the 50-level. It is, however, not clear how long the current session will last because, in the last few weeks, both bullish and bearish sessions have been frequent. Therefore, it is important to watch the resistance and support levels coupled with the movement of other indicators within the daily chart to detect the next direction that the coin may follow.
Against Bitcoin, the market price is hovering above the 9-day and 21-day moving averages as the coin trades at 1762 SAT. Therefore, if the coin can make a cross above the upper boundary of the channel, the bulls may push the price to the next available resistance at 1827 SAT.
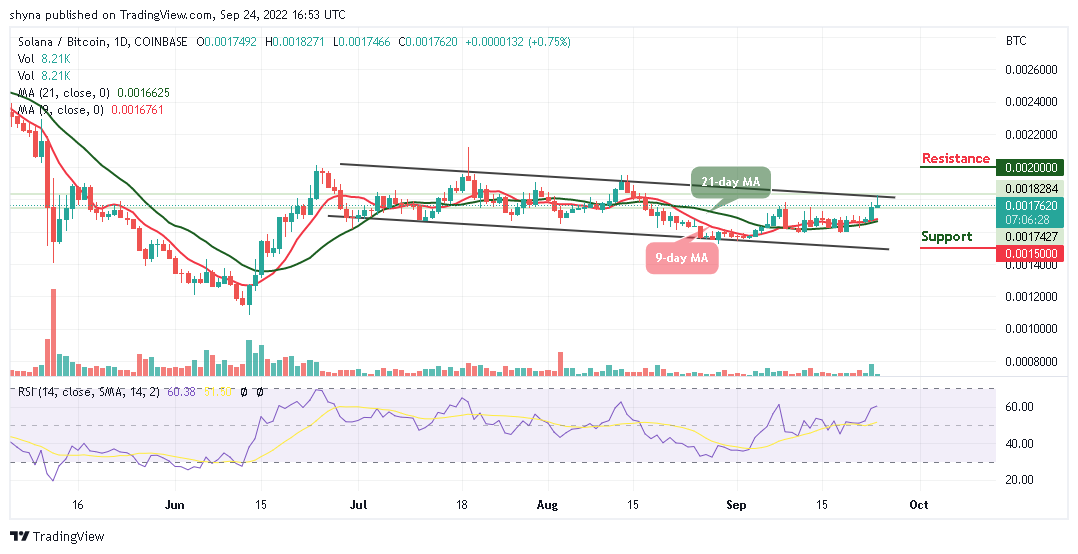
However, if the market drops below the moving averages, the price could hit the next key support at 1500 SAT and below. On the bullish side, a possible rise may push the market above the channel which could hit the resistance level of 2000 SAT and above. As revealed by the technical indicator, the Relative Strength Index (14) may continue with the upward movement as the signal line moves above the 60-level.
Join Our Telegram channel to stay up to date on breaking news coverage