Join Our Telegram channel to stay up to date on breaking news coverage
The Bitcoin price prediction shows that BTC may face down but consolidation is likely to play out between $20,000 and $21,000.
Bitcoin Prediction Statistics Data:
- Bitcoin price now – $21,256
- Bitcoin market cap – $406.5 billion
- Bitcoin circulating supply – 19.1 billion
- Bitcoin total supply – 19.1 billion
- Bitcoin Coinmarketcap ranking – #1
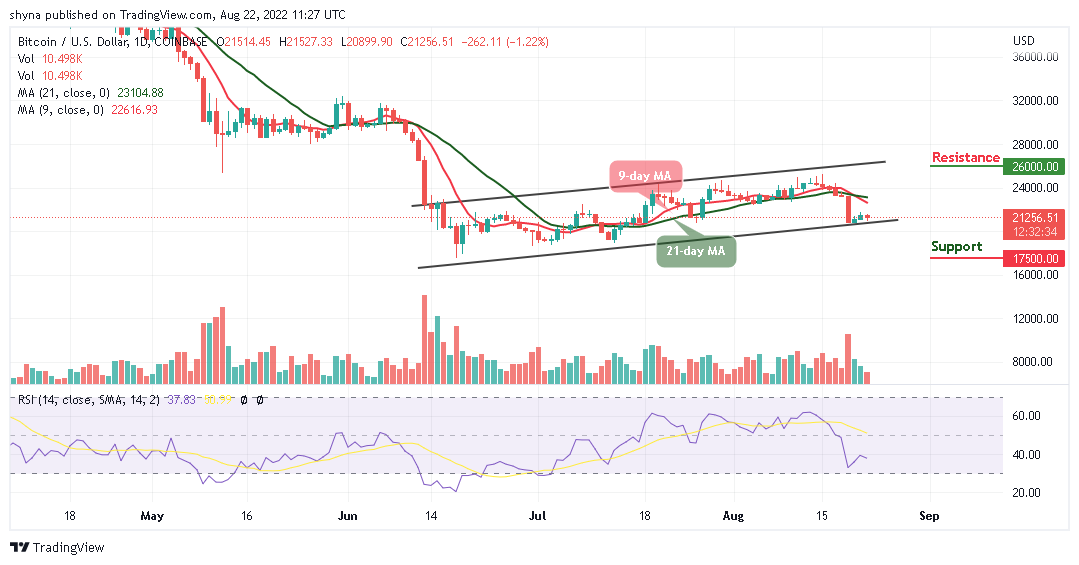
BTC/USD Long-term Trend: Ranging (Daily Chart)
Key levels:
Resistance Levels: $26,000, $28,000, $30,000
Support Levels: $17,500, $15,500, $13,500
Your capital is at risk
Today, BTC/USD retreats below the resistance level of $21,256. The number-one crypto is likely to cross below the lower boundary of the channel as the price remains below the 9-day and 21-day moving averages. However, the Bitcoin price did not stay up for long because of an immediate reversal. Therefore, the daily chart reveals that the market may experience a slight bearish movement.
BTC May Range-bounds as Tamadoge (TAMA) Remains Bullish
At the time of writing, the Bitcoin price is hovering at $21,256 with a loss of 1.22% on the day. The trading is likely to continue a downward movement as the technical indicator Relative Strength Index (14) remains below the 60-level. The bulls must reclaim the position above $22,000 as this would allow them to focus on higher levels towards $24,000. On the other side, continued declines under the short-term support at $21,000 could easily open the way to the south.
Meanwhile, the breakdown towards $20,000 is not out of the picture because the losses in the last 24 hours show that BTC/USD may not be technically ready for the breakout above $22,000 but the king coin can still make an attempt to regain ground and any bullish movement to the upside may push the coin to the resistance level of $26,000, $28,000, and $30,000 while the supports lie at $17,500, $15,500, and $13,500 respectively.
BTC/USD Medium-term Trend: Bearish (4H Chart)
The Bitcoin price is hovering within the 9-day and 21-day moving averages according to the 4-hour chart. However, if the price drops and moves below the moving averages, it could reach the nearest support levels at $19,500 and below.
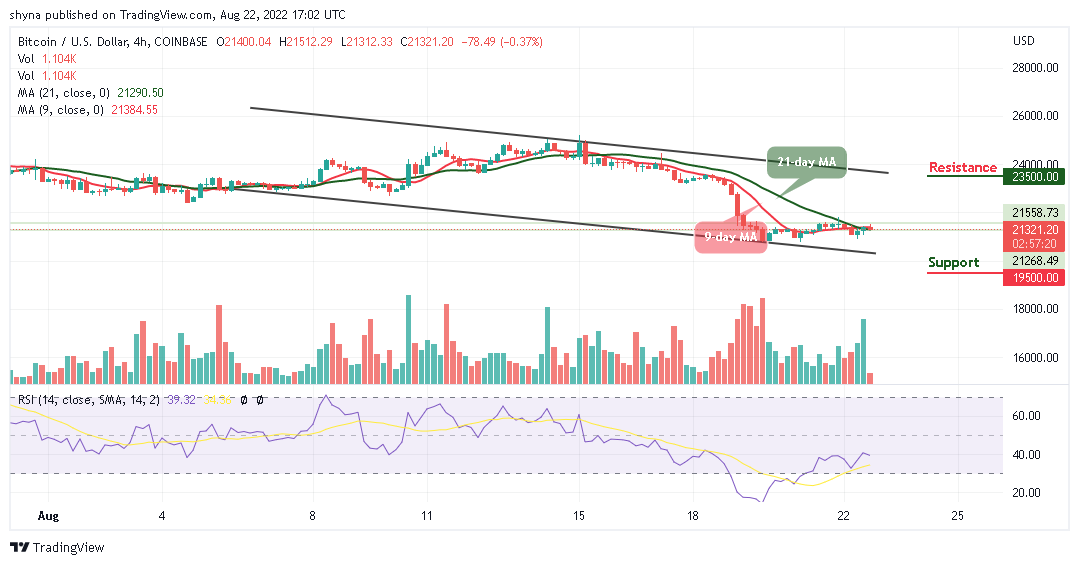
Moreover, if the bulls push the coin towards the upper boundary of the channel, the Bitcoin price may likely reach the potential resistance level of $23,500 and above. Now, the market is likely to rebound as the technical indicator Relative Strength Index (14) moves around 40-level.
Related:
- How to Buy Tamadoge
- Visit Tamadoge Website
Join Our Telegram channel to stay up to date on breaking news coverage