
Join Our Telegram channel to stay up to date on breaking news coverage
After touching the low of $20,782, BTC is currently trading at $21,067 as the coin seems to be preparing for another upward movement.
Bitcoin Prediction Statistics Data:
- Bitcoin price now – $21,067
- Bitcoin market cap – $404billion
- Bitcoin circulating supply – 19.1 million
- Bitcoin total supply – 19.1 million
- Bitcoin Coinmarketcap ranking – #1
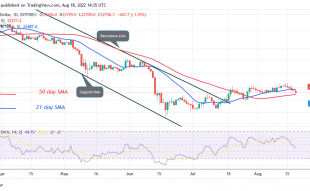
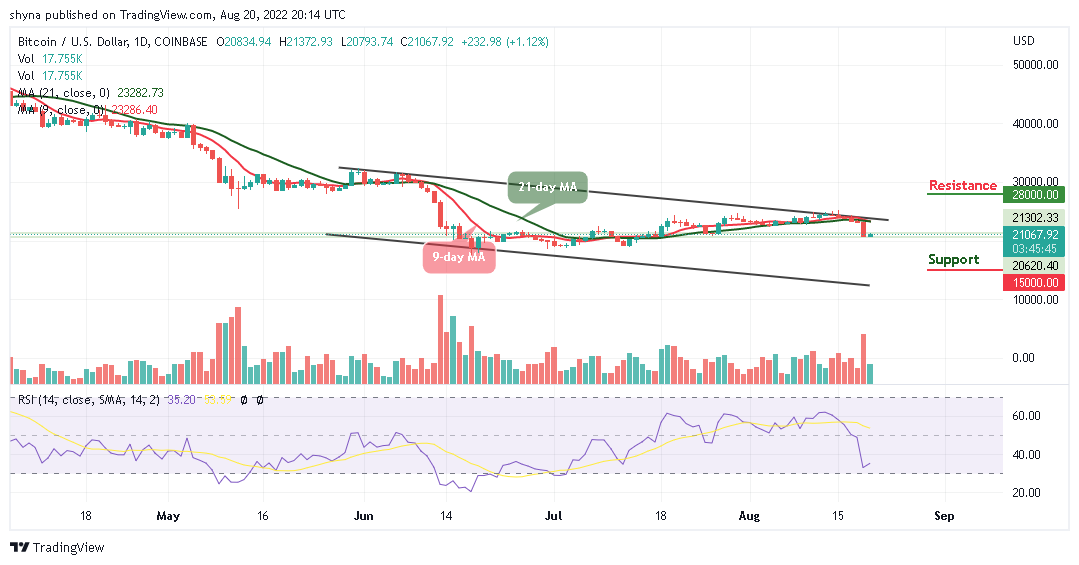
BTC/USD Long-term Trend: Ranging (Daily Chart)
Key levels:
Resistance Levels: $28,000, $30,000, $32,000
Support Levels: $15,000, $13,000, $11,000
Your capital is at risk
BTC/USD is trading below the 9-day and 21-day moving averages at $21,067 as the coin prepares to establish a bullish movement. At the time of writing, the first digital coin is likely to extend towards the resistance level of $22,000 if the bulls put more pressure on the market.
BTC Ready for A Cross Above $21k as Tamadoge Appears Bullish
The Bitcoin price is heading towards the upside, trying to create a bullish movement. Any further bullish movement above the 9-day and 21-day moving averages could locate the potential resistance levels at $28,000, $30,000, and $31,000. Nevertheless, if BTC/USD soars and crosses the upper boundary of the channel, this could be a sign of sustainability and may result in a bullish continuation.
However, if the Bitcoin price fails to move up; traders may see another price cut towards the lower boundary of the channel; a further low could bring the price to the support levels at $15,000, $13,000, and $11,000 respectively. But as it stands, the Bitcoin price is likely to rise as the technical indicator Relative Strength Index (14) moves to cross above the 35-level.
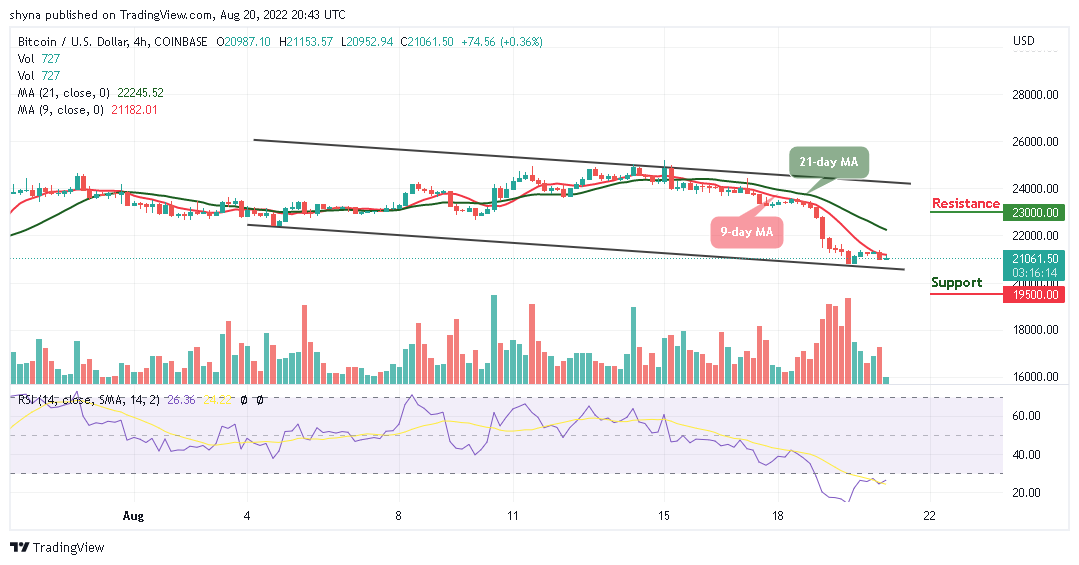
BTC/USD Medium-term Trend: Ranging (4H Chart)
According to the 4-hour chart, the market is following a sideways movement below the 9-day and 21-day moving averages as the bulls are coming back into the market to push the king coin to the upside. If not, the support level of $19,500 and below may come into play.
However, if the bulls push the market above the moving averages, traders may expect a retest of the $22,000 resistance level, and breaking this level may further push the price towards the resistance level of $23,000 and above as the technical indicator Relative Strength Index (14) prepares to leave the oversold region.
The Tamadoge team is celebrating the notable success of the presale by launching a $100,000 giveaway. There are multiple ways that people can participate in the prize pool. However, the requirement for those who want to participate in the prize pool is to hold a minimum of $100 worth of TAMA tokens on the day of the draw.
Related:
- How to Buy Tamadoge
- Visit Tamadoge Website
Join Our Telegram channel to stay up to date on breaking news coverage