
Join Our Telegram channel to stay up to date on breaking news coverage
The Bitcoin price prediction gains 0.27% as bulls keep working hard on BTC to nurture a bullish trend towards the upside.
Bitcoin Prediction Statistics Data:
- Bitcoin price now – $21,709
- Bitcoin market cap – $414.9 billion
- Bitcoin circulating supply – 19.1 million
- Bitcoin total supply – 19.1 million
- Bitcoin Coinmarketcap ranking – #1
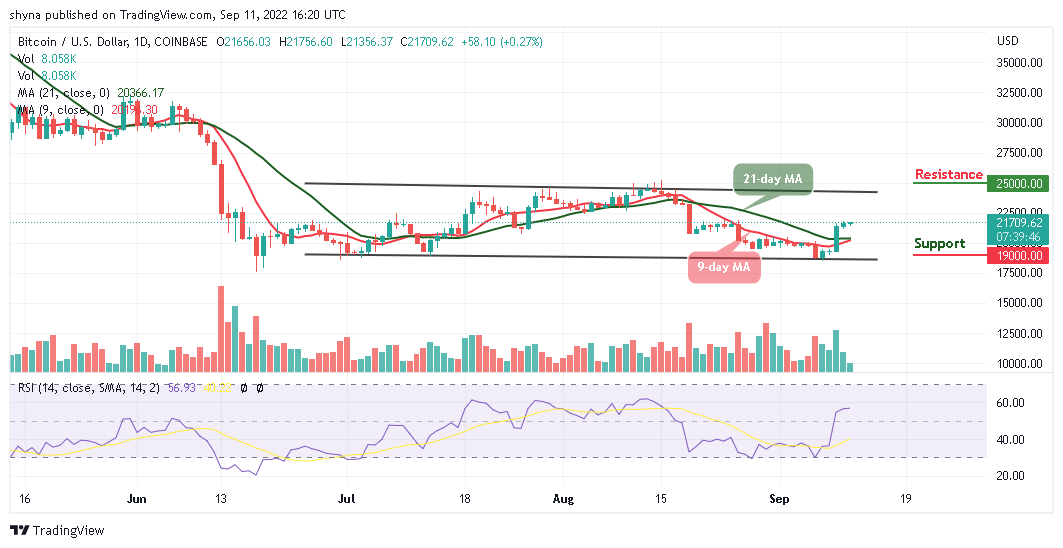
BTC/USD Long-term Trend: Ranging (Daily Chart)
Key levels:
Resistance Levels: $25,000, $27,000, $29,000
Support Levels: $19,000, $17,000, $15,000
Your capital is at risk
BTC/USD is hovering at the $21,709 resistance level as the market price stays above the 9-day and 21-day moving averages, indicating a bullish movement. For the past few days, the Bitcoin price has been moving positively and in the context of the Bitcoin exchange rate forecast; an application of $22,000 resistance is expected.
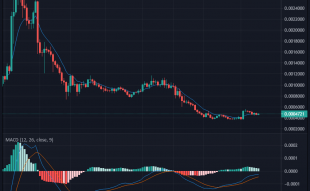
Will BTC Break Above $22,000 Level as TAMA Trades Positively?
If the Bitcoin price can cross above the resistance level of $22,000, it is likely for the market price to touch the potential resistance of $24,000 level. This is where traders should expect buyers to fight for a further rise in BTC/USD and further development of the bullish trend. Meanwhile, looking at the market movement, there is likely that the Bitcoin price may experience a quick retracement or sell-off just in case it touches the crucial $20,000 support level but if not; traders may see additional resistance levels of $22,000 and $23,000 before pushing higher.
However, any further bullish movement could hit the resistance level of $25,000, $27,000, and $29,000 respectively. On the downside, if the market decides to cross below $21,000 support, BTC/USD could head towards the lower boundary of the channel, and if that support fails to hold the sell-off, the Bitcoin price could see a further decline toward the support levels of $19,000, $17,000, and $15,000. As revealed by the technical indicator, the market may gain more if the Relative Strength Index (14) crosses above the 60-level.
BTC/USD Medium-term Trend: Ranging (4H Chart)
On the 4-hour chart, the Bitcoin price is moving sideways and it could move above the upper boundary of the channel if the bullish pressure increases. On the contrary, if the selling pressure still exists and holds the coin does not follow the upward movement, the $20,500 and below may come into play.
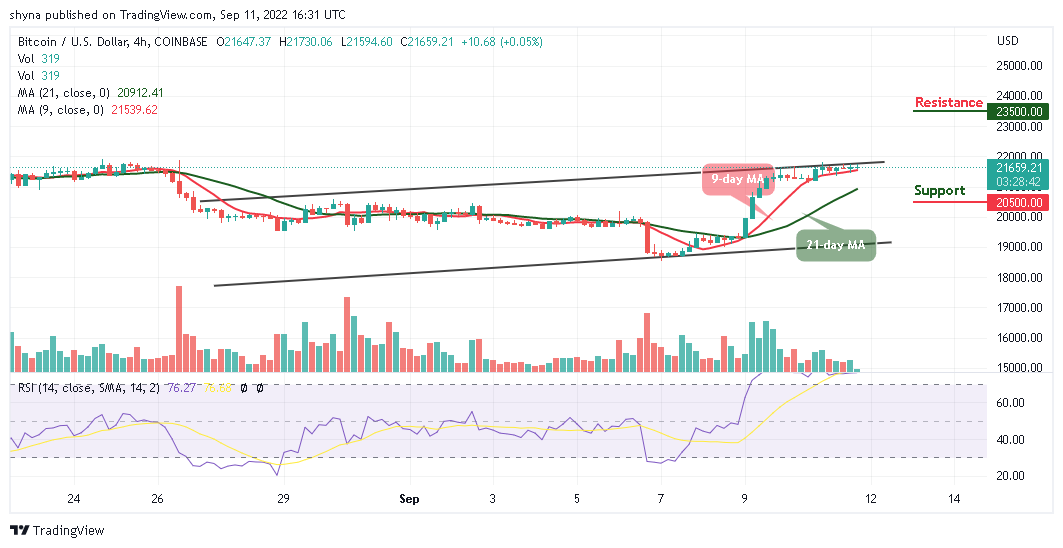
However, in as much as the buyers keep the price above the 9-day and 21-day moving averages, traders may expect a strong bullish movement that could hit the resistance at $23,500 and above. Meanwhile, the technical indicator Relative Strength Index (14) is within the overbought region, suggesting that more bullish signals may play out.
The Tamadoge team said that the move aims to make investing in TAMA easy and safe. These users can be confident in transferring fiat into crypto, hence the need for Tamadoge to secure this deal with Transak. One of the strongest pillars of any project in the web 3.0 & crypto sector is having a solid team to see the project succeed. The TAMA website has revealed Thomas Seabrook as the Tamadoge lead developer and Carl Dawkins as the head of growth. The other members of the Tamadoge team include Neil Palethorpe and Siphamandla Mjoli, who have joined as the Senior Interaction Designer and the Senior Blockchain Developer, respectively.
Related:
Join Our Telegram channel to stay up to date on breaking news coverage