
Join Our Telegram channel to stay up to date on breaking news coverage
At the time of writing, the Bitcoin price prediction is dropping over 1.29% within 24 hours as it trades around the $19,991 level.
Bitcoin Prediction Statistics Data:
- Bitcoin price now – $19,759
- Bitcoin market cap – $377 billion
- Bitcoin circulating supply – 19.1 million
- Bitcoin total supply – 19.1 million
- Bitcoin Coinmarketcap ranking – #1
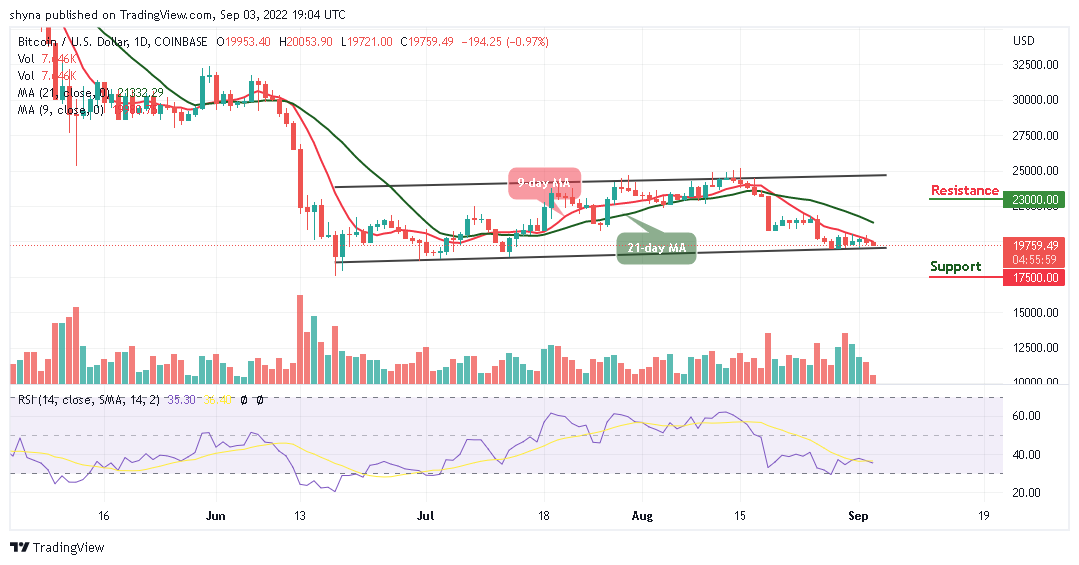
BTC/USD Long-term Trend: Bearish (Daily Chart)
Key levels:
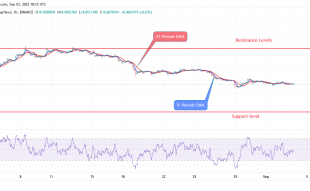
Resistance Levels: $23,000, $25,000, $27,000
Support Levels: $17,500, $15,500, $13,500
Your capital is at risk
The daily chart reveals that BTC/USD failed to break above the 9-day moving average as the king coin begins the day off by trending lower towards the support level of $19,500 and may likely cross the lower boundary of the channel. However, the first support level is $19,000. Beneath this, other supports lie at $17,500, $15,500, and $13,500.
Bitcoin (BTC) May Trend Downward as Buyers Prefer Tamadoge (TAMA)
As shown in the daily chart, the Bitcoin price fails to stay above the 9-day moving average as it looks to set up another few days of negative price declines beneath $20,000. Meanwhile, a break above the daily high at $20,053 would have set the king coin up to reach the nearest resistance at the $21,000 level. But, traders can see Bitcoin fails to break up as the technical indicator Relative Strength Index (14) heads to the south.
The Bitcoin price couldn’t go higher as it is dropping towards the lower boundary of the channel. More so, should the technical indicator slide to the downside, the market price may end on the negative side. Nevertheless, any bullish movement above the 9-day and 21-day moving averages could hit the resistance levels at $23,000, $25,000, and $27,000.
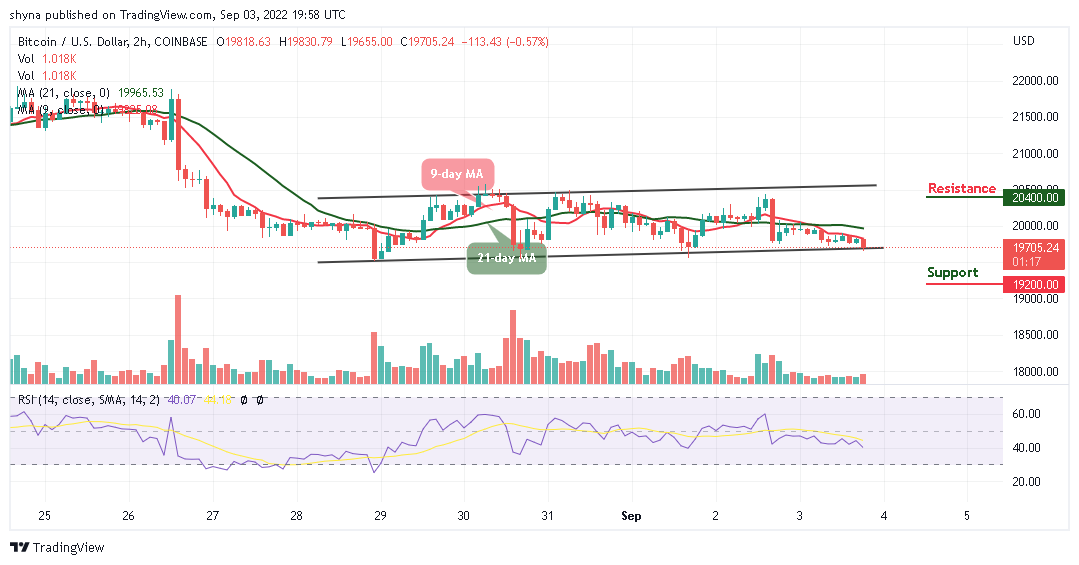
BTC/USD Medium-term Trend: Ranging (4H Chart)
The 4-hour chart reveals that buyers may take time to come back into the market if the price remains below the 9-day and 21-day moving averages. Therefore, if the bulls step back and push the coin above the moving averages, the Bitcoin price may hit the resistance level of $20,500 and above.
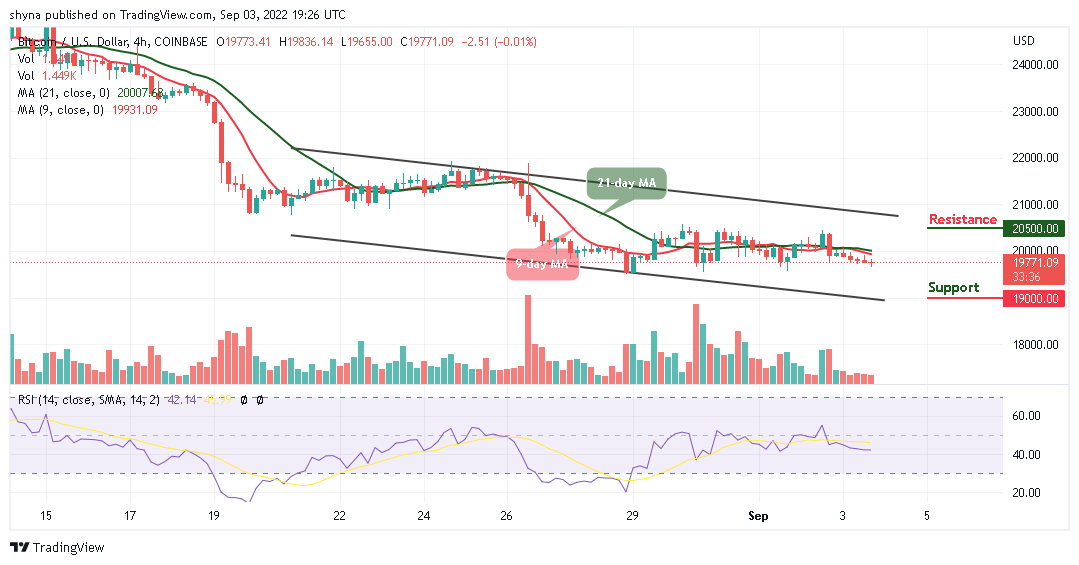
Nevertheless, if the sellers bring the current market value below the support level of $19,500, breaking this level may further allow the coin to hit the support at $19,000 and below. At the moment, the technical indicator Relative Strength Index (14) may likely cross below the 40-level to give additional bearish signals to the market.
Tamadoge will give everyone the ability to mint the doges they want to, and will allow users to breed, train and battle their Tamadoge NFTs to top the leaderboard every single month. Over time the Play-to-Earn opportunities will be expanded to include augmented reality experiences, allowing your NFT to play with its friends in the Tamaverse. Tamadoge isn’t just the future of the Doge ecosystem, it’s the future of Play-to-Earn.
Related:
Join Our Telegram channel to stay up to date on breaking news coverage