Join Our Telegram channel to stay up to date on breaking news coverage
Bitcoin SV (BSV) Price Analysis – June 13
After surging 11% today, BSV price has increased substantially as the market respect the three weeks diagonal support line. If the market falls below this line of support, we can expect a significant bearish scenario for the BSV markets. Currently, the bulls have taken charge.
BSV-USD Market
Key Levels:
Resistance levels: $240, $260
Support levels: $180, $160
The last month surge in volatility which led Bitcoin SV to $250 has now carved a bull flag pattern for the market as the price actions obey the yellow trend lines, acting as a support and resistance line for the BSV market for the past two weeks. Meanwhile, the blue ascending line has diagonal support for the market as well right from $60.
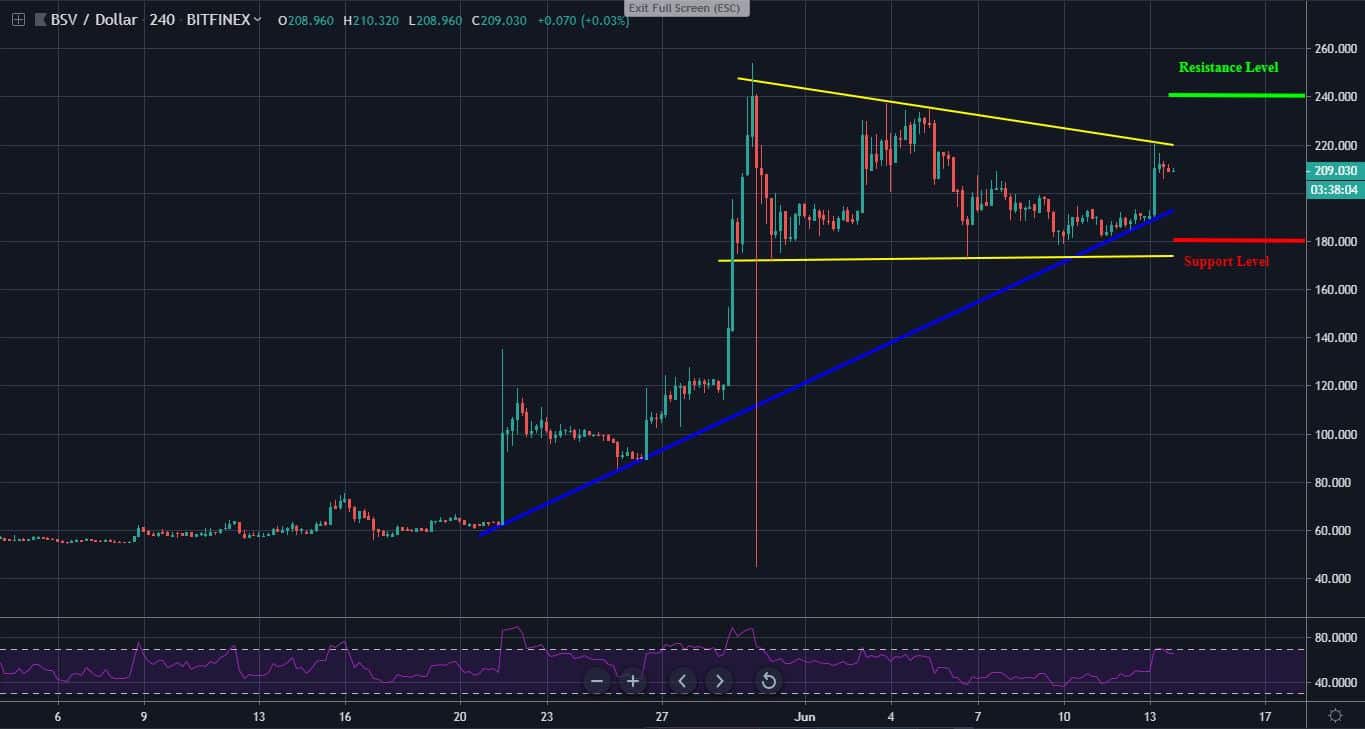
Today, BSV saw a price surge to $220 at the upper trend line before dropping to the current trading price at $208. The recent price increase was revealed on the 4-hours RSI, crossing over the 50 level. If the market continues to climb, a bullish break may hit the $240 and $260. A price drop, however, may find support at $180. The $160 may further be located below the yellow trend line
BSV-BTC Market
Following the bull flag pattern, Bitcoin SV nears a tight range on the yellow symmetrical triangle as the market may breakout sooner or later. If a breakout occurs, the BSV market would witness a new price level. From above, the key resistance levels for the market lie at 0.03BTC and 0.034BTC. From below, the key support level to watch out for is at $0.023BTC and 0.02BTC.
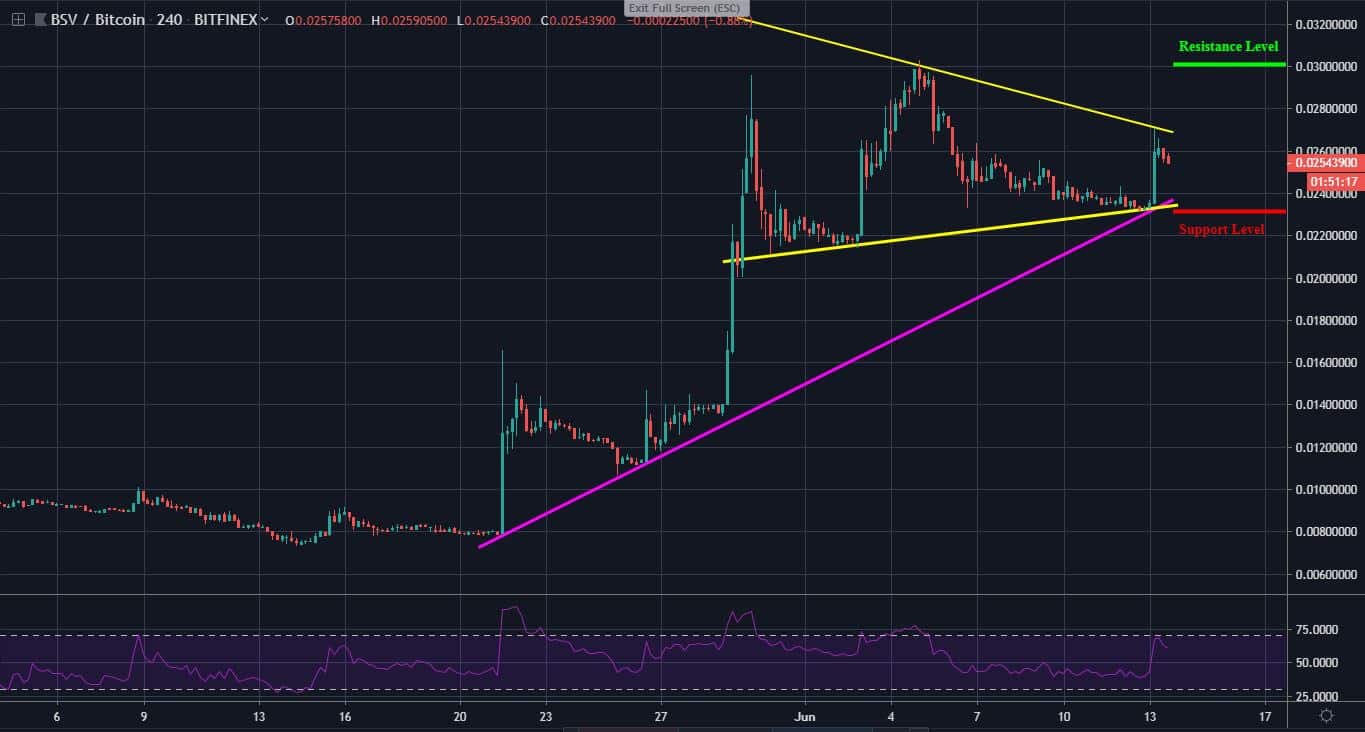
However, the sudden price increase we saw in the market today was quickly reflected on the 4-hours RSI as it switched trend to the positive level, a sign for potential bullish. The RSI may resume falling back below the 50 level if a bearish surge occurs. For now, the pink ascending trend line has been strong diagonal support for the market since May 21.
Please note: insidebitcoins.com is not a financial advisor. Do your own research before investing your funds in any financial asset or presented product or event. We are not responsible for your investing results.
Join Our Telegram channel to stay up to date on breaking news coverage