
Join Our Telegram channel to stay up to date on breaking news coverage
Bitcoin’s Bullish Momentum: Moving Averages Indicate Growth
The Bitcoin price prediction indicates that there is a projected increase of 0.56% in its value. This positive movement is driven by the efforts of bullish investors who are actively working to maintain a bullish trend above the moving averages.
By keeping the price above these averages, they aim to sustain the upward momentum and potentially attract more buyers to the market.
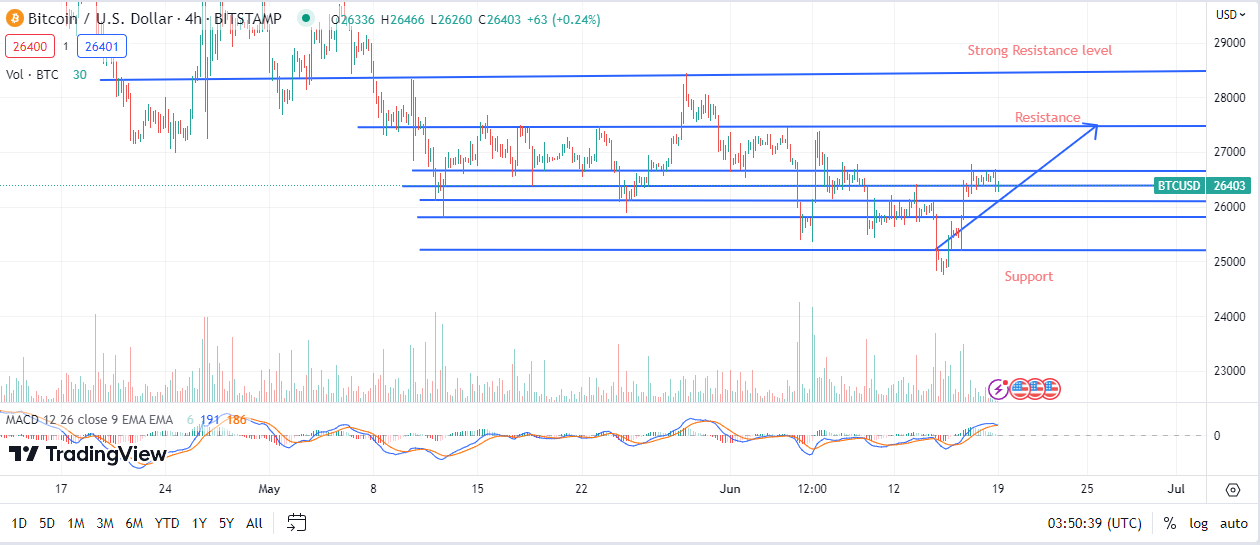
The price of BTC/USD is currently around $26,400, which is a level that is proving difficult to surpass. However, there is a positive sign as the market price is trying to go above the 7-day and 14-day moving averages, suggesting a bullish trend.
In recent days, the price of Bitcoin has been moving within a specific range, and considering the forecast for the exchange rate, it is anticipated that the price might encounter resistance of around $27,500.
Bitcoin Statistics
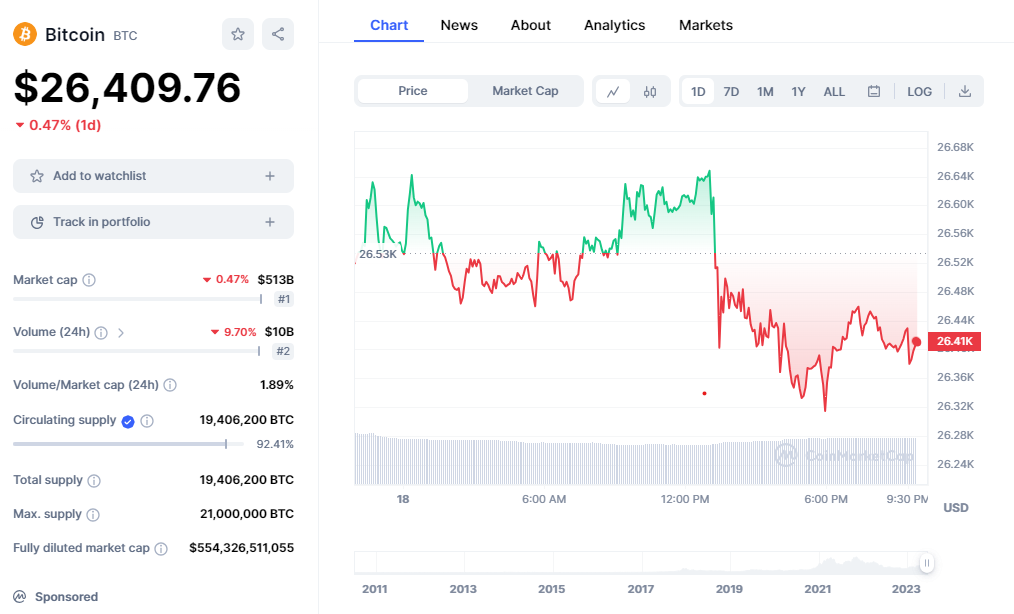
- Bitcoin Coinmarketcap ranking – #1
- Bitcoin price now – $26,400
- Bitcoin market cap – $512.096 billion
- Bitcoin circulating supply – 19.41 million
- Bitcoin total supply – 19.41 million
- Bitcoin maximum supply – 21 million
Will BTC Break Above the $27,500 Level?
When we look at the daily chart, if the price of Bitcoin moves toward the upper limit of its trading range, there is a chance it could reach a resistance level of around $27,500. At this point, traders can expect buyers to actively support further price increases, which could lead to additional gains for Bitcoin.

On the other hand, it’s also possible for the price to experience a rapid decrease or sell-off if it touches a critical support level at around $25,200. However, if that support level is not reached, traders may witness the price of Bitcoin breaking above the upper boundary of its trading range and continuing to rise.
Bitcoin may encounter resistance at levels of $33,200, $35,650, and $37,800 if the bullish trend continues. In the event that the market price falls below the trading range, BTC/USD could reach support levels of $22,450, $19,700, and $16,600 if the market price falls below the trading range.
The Relative Strength Index (RSI), a technical indicator used to determine a stock’s strength, indicates the potential for further gains if the index crosses the 50-level.
BTC/USD Medium-term (4H Chart)
Based on the 4-hour chart, traders hope the coin will regain its previous momentum, break above the upper limit of the range within which it is currently trading, and regain its previous momentum again.
In contrast, if there is a lot of selling activity and the coin does not seem to be able to continue its upward movement, the price could drop to $25,200 or even lower if there is a lot of selling activity going on.
Traders can anticipate significant upward movement above the trading range if the buyers successfully maintain the price above the 7-day and 14-day moving averages.
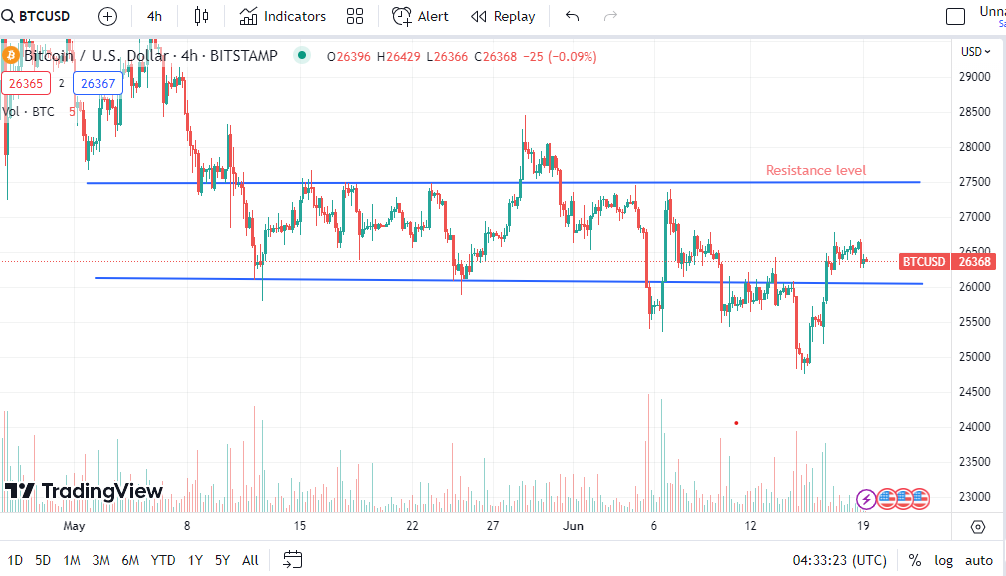
Due to this, the price could reach a resistance level of $27,500 or even higher. In addition, the Relative Strength Index (RSI) is currently above the 50 level, indicating that the market price is likely to rise soon
Best Wallet - Diversify Your Crypto Portfolio

- Easy to Use, Feature-Driven Crypto Wallet
- Get Early Access to Upcoming Token ICOs
- Multi-Chain, Multi-Wallet, Non-Custodial
- Now On App Store, Google Play
- Stake To Earn Native Token $BEST
- 250,000+ Monthly Active Users
Join Our Telegram channel to stay up to date on breaking news coverage