Join Our Telegram channel to stay up to date on breaking news coverage
Key Points
- Bitcoin price rebounded and moved above the $6,400 level, but it failed near $6,600 against the US Dollar.
- There was a break below a major bullish trend line with support at $6,460 on the 4-hours chart of the BTC/USD pair (data feed from Kraken).
- The pair remains in a broad range between $6,000 and $6,600, and it may continue to trade sideways.
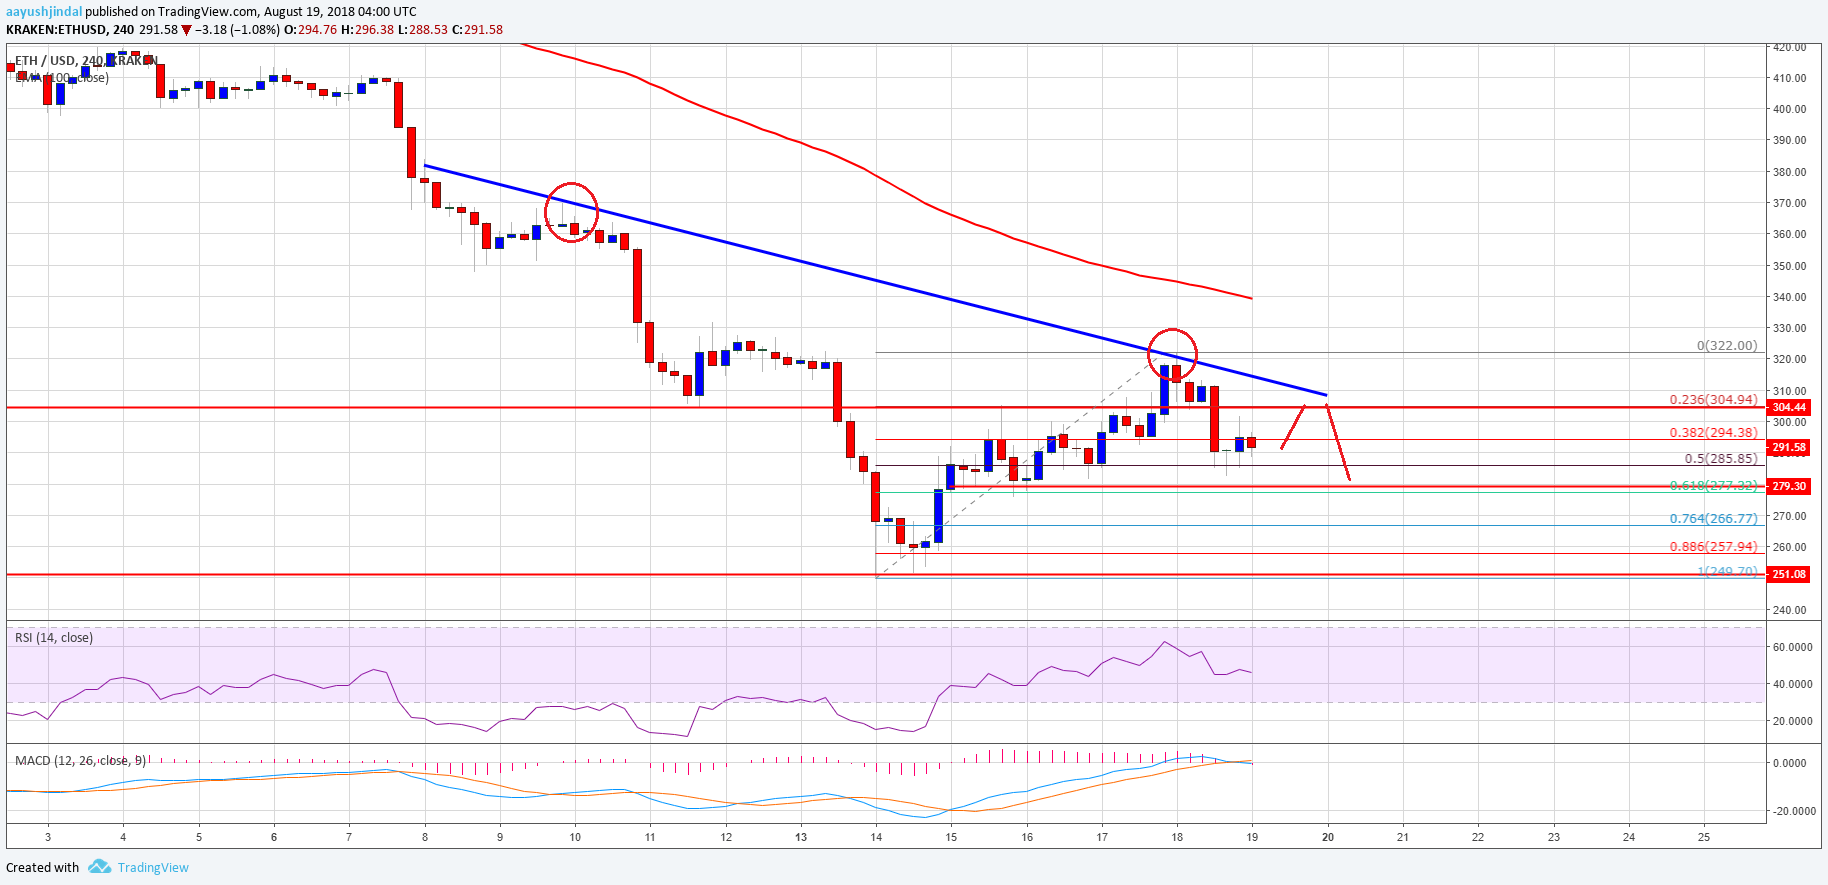
Bitcoin price failed once again near the $6,600-6,620 resistance against the US Dollar. BTC/USD is correcting lower and it could test the $6,275 and $6,188 supports.
Bitcoin Price Range Trading
This past week, there was a nice upward move from the $5,900 swing low in bitcoin price against the US Dollar. The BTC/USD pair traded above the $6,300 and $6,500 resistance levels. However, the price failed yet again near a significant resistance at $6,600-6,620. The stated resistance zone prevented gains above $6,650 and the 100 simple moving average (4-hours). As a result, the price declined and moved below the $6,500 level.
There was a break below the 23.6% Fib retracement level of the last leg from the $5,900 low to $6,653 high. Moreover, there was a break below a major bullish trend line with support at $6,460 on the 4-hours chart of the BTC/USD pair. It has opened the doors for more losses in the short term below the $6,300 support level. The next important support is the 50% Fib retracement level of the last leg from the $5,900 low to $6,653 high at $6,276. Below this, the price is likely to break the $6,250 level to test the $6,188-6,200 support zone.

Looking at the chart, BTC price seems to be trading in a broad range of $6,000-6,600. Therefore, there are chances of the current wave extending towards $6,200 and $6,000 before buyers appear.
Looking at the technical indicators:
4-hours MACD – The MACD for BTC/USD has moved back in the bearish zone.
4-hours RSI (Relative Strength Index) – The RSI is now below the 50 level.
Major Support Level – $6,200
Major Resistance Level – $6,600
The post Bitcoin Price Weekly Analysis: BTC/USD Failed Again Near $6,600, Now What? appeared first on NewsBTC.
Join Our Telegram channel to stay up to date on breaking news coverage