Join Our Telegram channel to stay up to date on breaking news coverage
Key Highlights
- ETH price corrected higher recently and traded above $310 and $315 against the US Dollar.
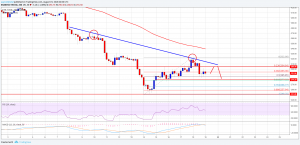
- There is a key connecting bearish trend line in place with current resistance at $311 on the 4-hours chart of ETH/USD (data feed via Kraken).
- The pair has to break the $311 and the $320 resistance levels for more upsides in the near term.
Ethereum price failed to remain in a positive zone versus the US Dollar and Bitcoin. ETH/USD settled below $300 and is facing resistances near $311 and $320.
Ethereum Price Resistances
After forming a base near the $249-250 zone, ETH price started an upside correction against the US Dollar. The ETH/USD pair traded higher and broke the $275 and $300 resistance levels. It even moved above the $315 level and traded as high as $322. Later, buyers lost the control, resulting in a fresh decline. The price dropped below the 23.6% fib retracement level of the last wave from the $249 low to $322 high.
More importantly, it declined back below the $300 level, which is not a good sign. However, the downside move was protected by the $285 support. It represents the 50% fib retracement level of the last wave from the $249 low to $322 high. The price is currently consolidating above the $285 level and is preparing for the next move. If sellers push the price below $285, it could increase selling pressure. The next supports are $279, $275 and $262. On the upside, there is a key connecting bearish trend line in place with current resistance at $311 on the 4-hours chart of ETH/USD.
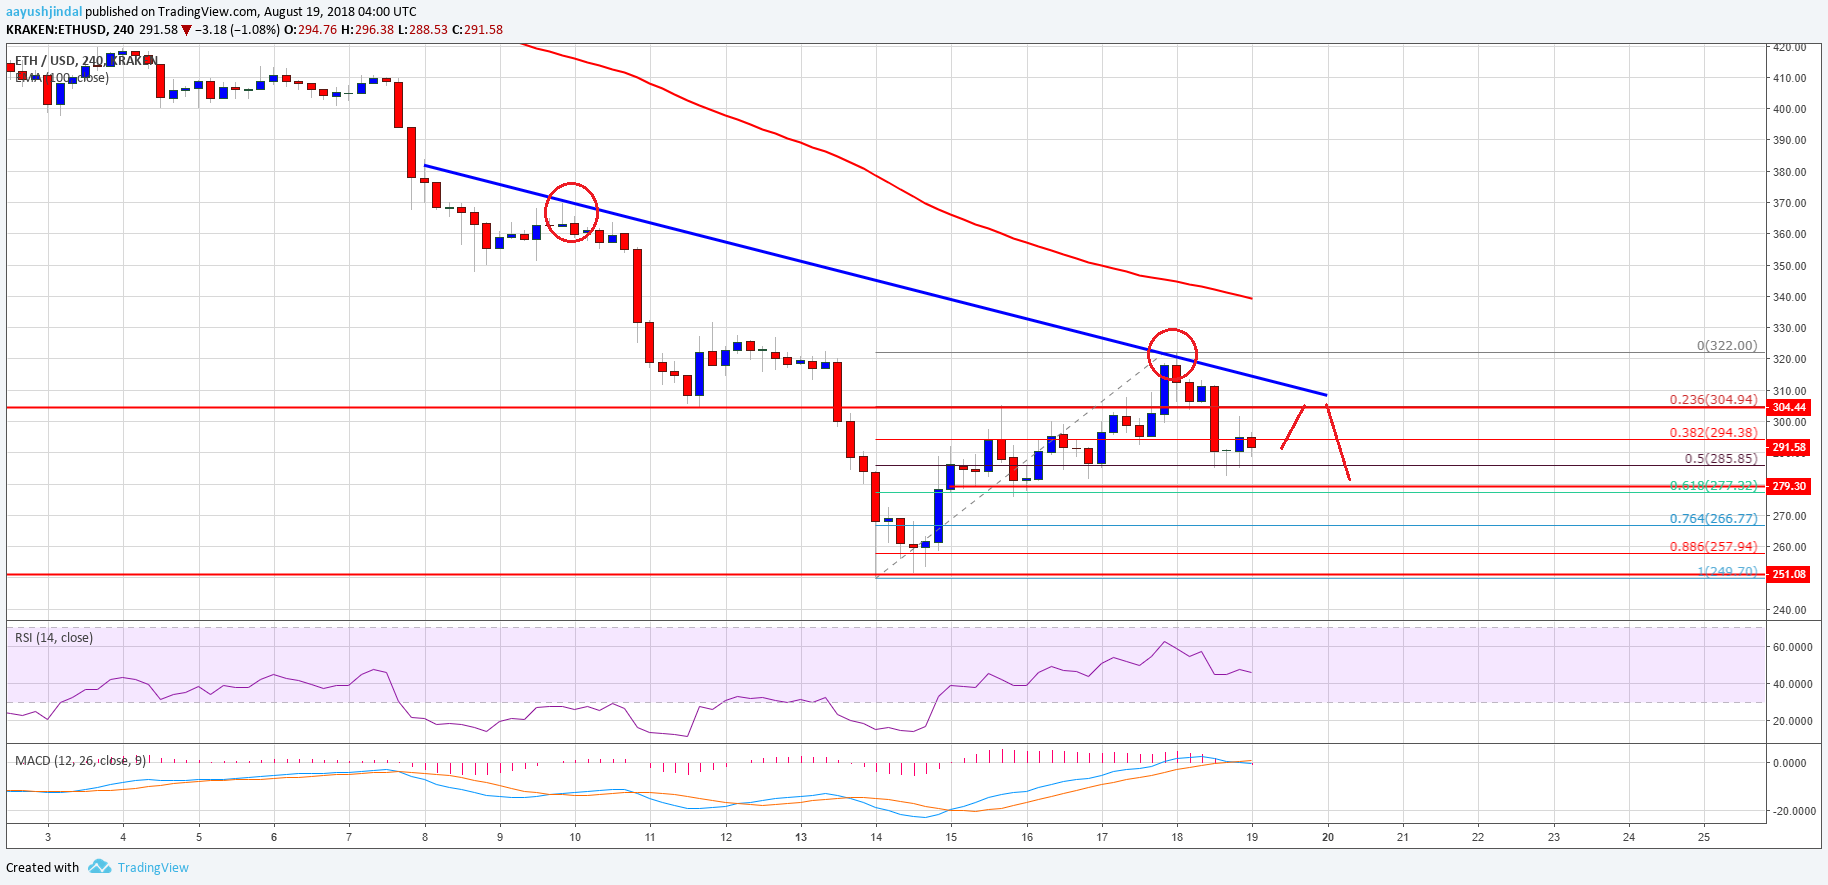
The above chart indicates that ETH price must break the trend line and $320 to gain momentum. The next resistance is near $340 and the 100 simple moving average (4-hours).
4-hours MACD – The MACD is showing signs of weakness in the bearish zone.
4-hours RSI – The RSI is currently just below the 50 level.
Major Support Level – $285
Major Resistance Level – $320
The post Ethereum Price Weekly Analysis: ETH/USD’s Upsides Capped Near $320 appeared first on NewsBTC.
Join Our Telegram channel to stay up to date on breaking news coverage