Join Our Telegram channel to stay up to date on breaking news coverage
Key Points
- Bitcoin price started a downside correction after trading as high as $6,849 against the US Dollar.
- There is a major bullish trend line formed with support near $6,560 on the hourly chart of the BTC/USD pair (data feed from Kraken).
- The pair should stay above the $6,550 support and the 100 hourly simple moving average to remain in an uptrend.
Bitcoin price declined after it failed to break the $6,850 level against the US Dollar. BTC/USD is currently trading near a major support area at $6,560.
Bitcoin Price Analysis
Yesterday, we saw a nice upward move above the $6,700 resistance in bitcoin price against the US Dollar. The BTC/USD pair even traded above the $7,800 resistance and settled above the 100 hourly simple moving average. However, the price failed to break the $7,850 level, resulting in a bearish reaction. The price started a downside correction and declined below the $6,700 support area.
There was a break below the 50% Fib retracement level of the last wave from the $6,359 low to $6,849 high. Later, BTC buyers appeared above the $6,600 level and protected more losses. More importantly, a major bullish trend line with support near $6,560 on the hourly chart of the BTC/USD pair stopped declines. Lastly, the 61.8% Fib retracement level of the last wave from the $6,359 low to $6,849 high also acted as a support along with the 100 hourly SMA. Therefore, the $6,660/50 support zone holds a lot if importance to the next move in the near term.
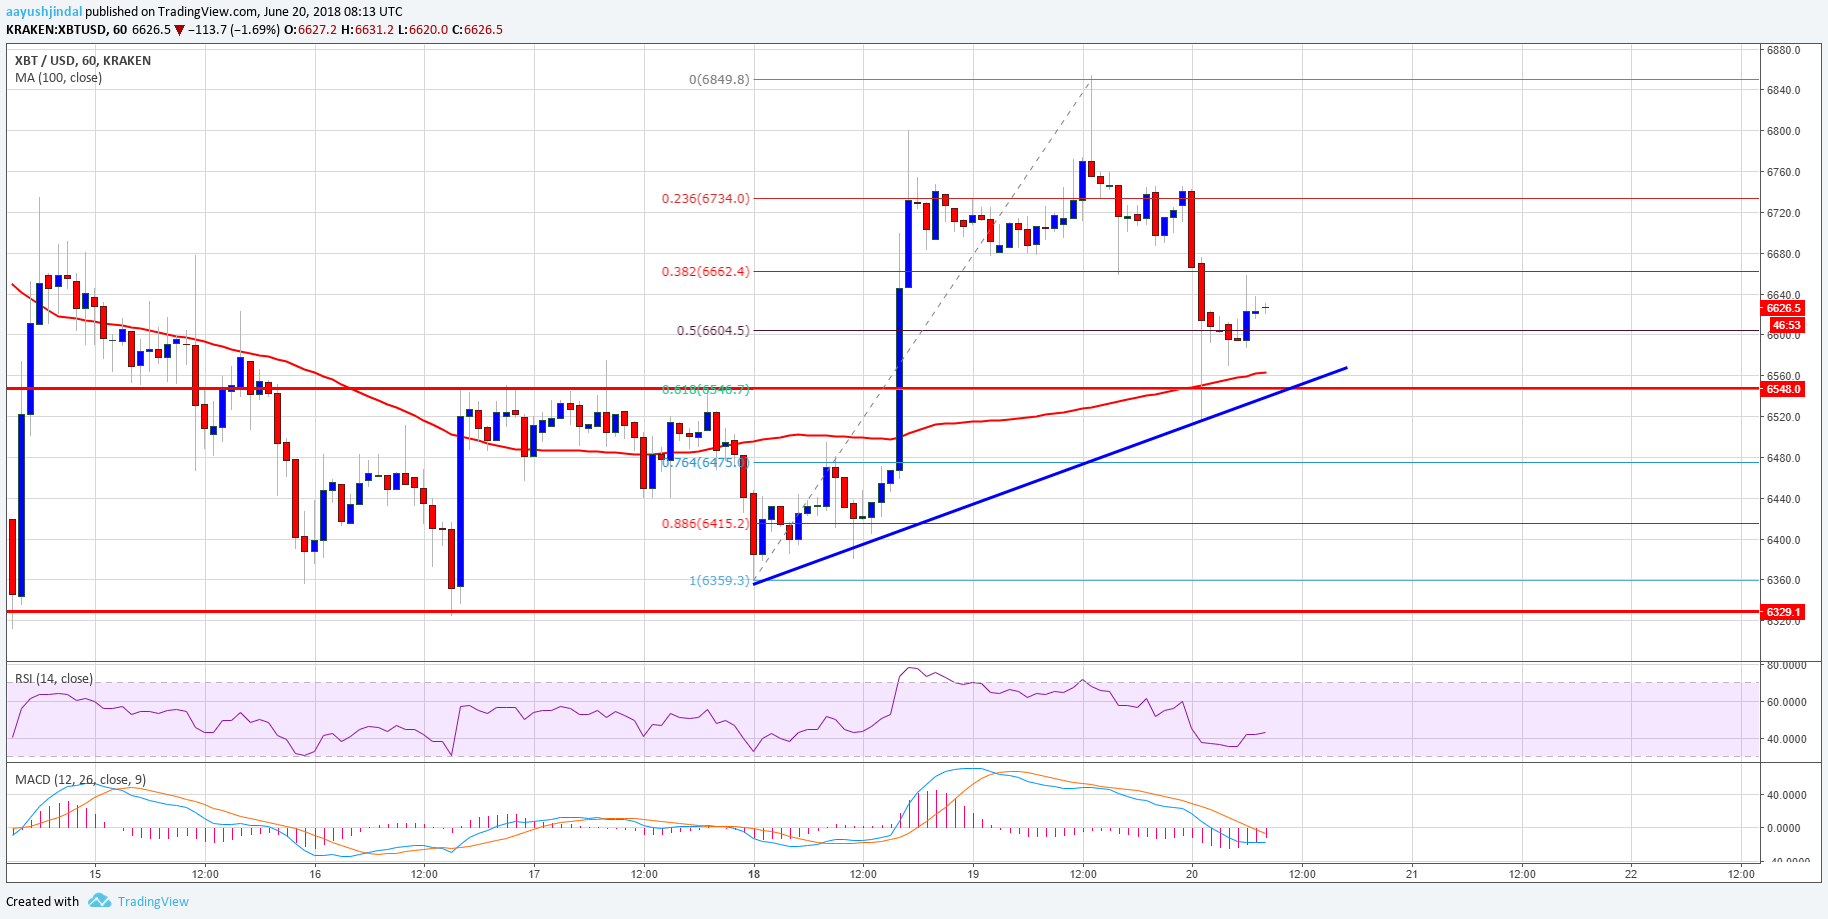
Looking at the chart, if the price succeeds in staying above the $6,650 support, it could bounce back. On the upside, resistances are seen near the $6,700 and $6,800 levels, followed by the $6,850 swing high.
Looking at the technical indicators:
Hourly MACD – The MACD for BTC/USD has moved back in the bearish zone.
Hourly RSI (Relative Strength Index) – The RSI is now well below the 50 level with very few positive signs.
Major Support Level – $6,650
Major Resistance Level – $6,800
The post Bitcoin Price Watch: BTC/USD Testing Crucial Support appeared first on NewsBTC.
Join Our Telegram channel to stay up to date on breaking news coverage