Join Our Telegram channel to stay up to date on breaking news coverage
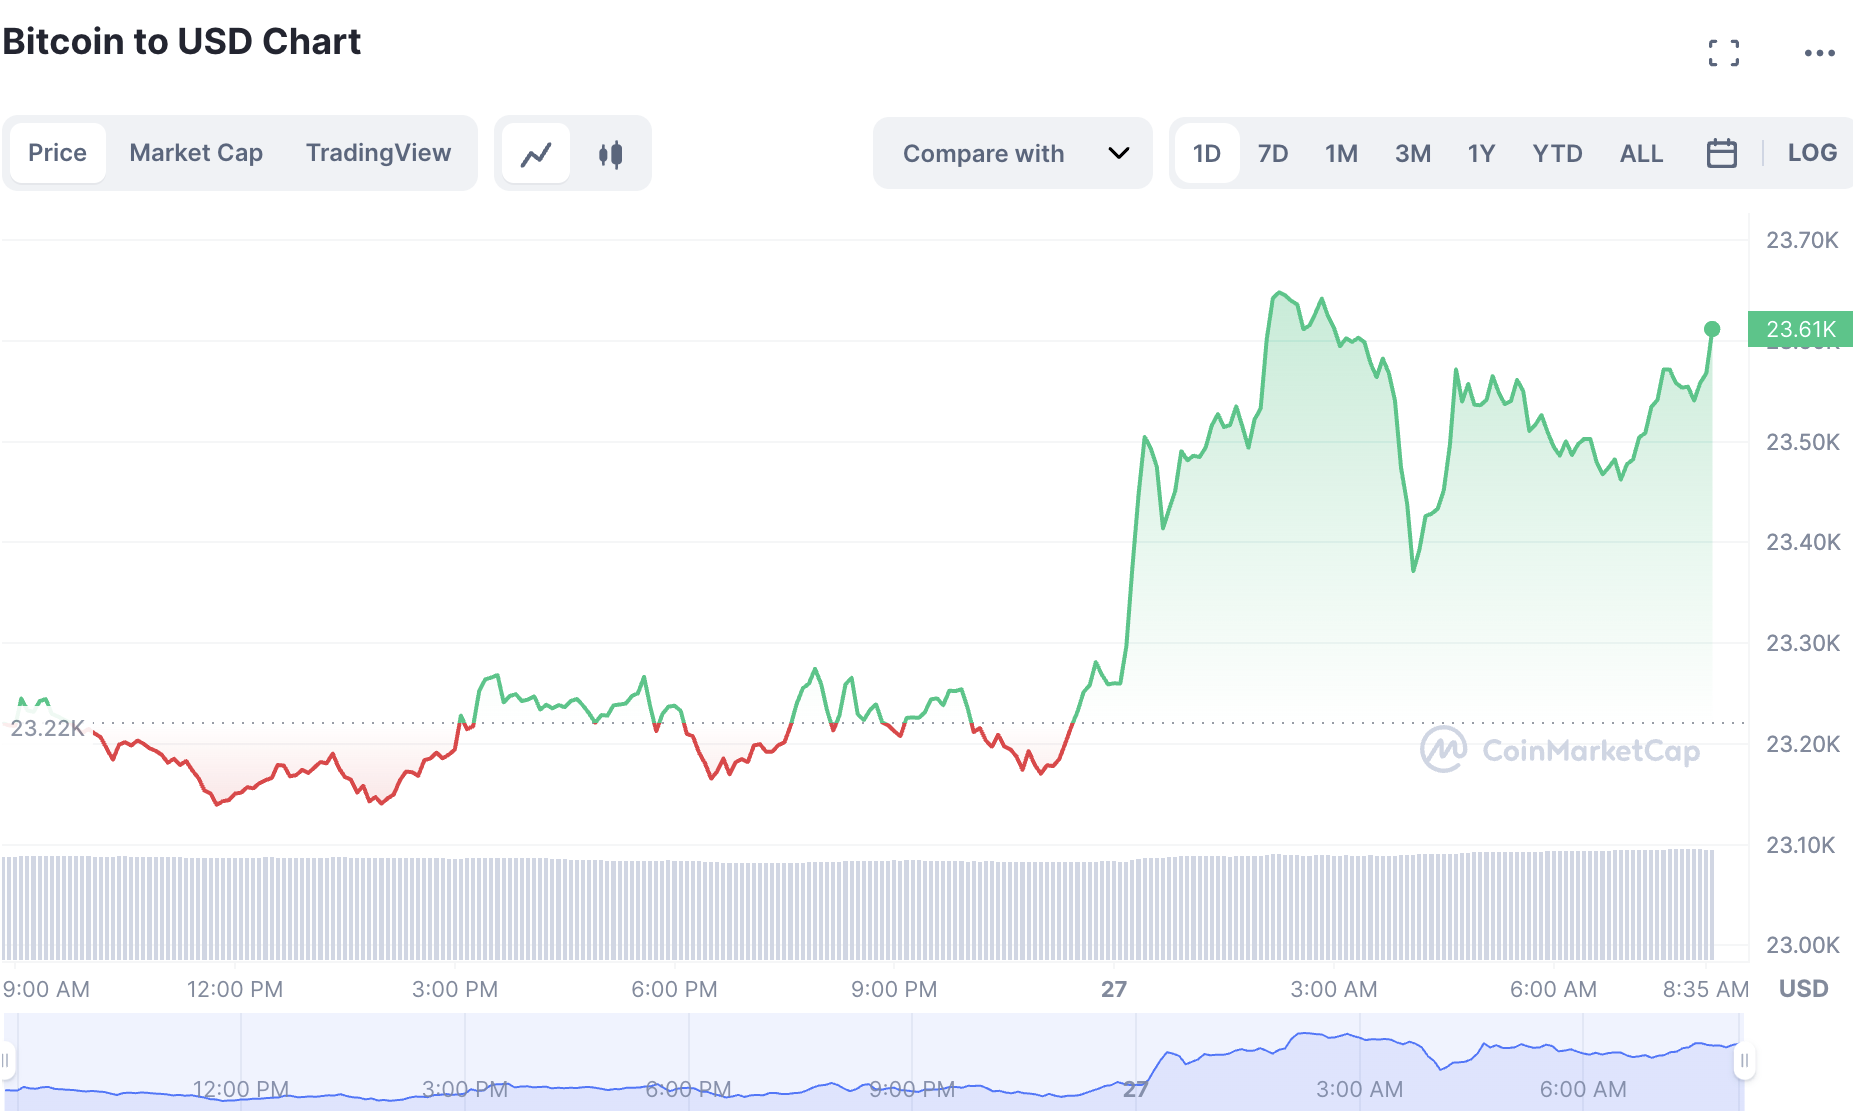
As of February 26, the price of Bitcoin has increased by 1.06% over the last 24 hours to $23,260.50. With the most recent Bitcoin price movement, the market capitalization of tokens was $448,963,594,230.25. Bitcoin has experienced a shift of 40.34% so far this year. According to the DACS, Bitcoin is categorized as a potential virtual currency.
The Bitcoin price prediction is that the negative action may persist below the $23,200 support level based on the daily chart.
Will Bitcoin Rise Following the Rebalance of the February 15 Surge?
The Bitcoin price is at $23,260.50, and in the previous 24 hours, $24.8 billion worth of trade has taken place. The price has dropped by 2.77% during the past day, and the token’s market capitalization is still $446 billion.
Although it has successfully rebounded from the $23,100 level, where it had previously broken its support, bitcoin is now facing resistance at $23,375. If Bitcoin wants to hit $24,500 and then go towards $2,500, it must effectively break through this barrier at $24,100.
The short-term trajectory of the token will be significantly influenced by the $23,600 as well as the $23,350 levels since the RSI and MACD indicators are now remaining in the selling zone. As the price of bitcoin rises above these levels, investors will have the chance to buy it, with a potential brief surge.
Bitcoin’s (BTC) support level may reach $22,000
After a 0.73% intraday decline, the price of one bitcoin is essentially unchanged at $23,046. The first virtual asset is expected to settle in a bearish label pattern, as we can see from the daily chart, where the dominant trend is negative with rising volatility. In the meanwhile, a collapse below the channel’s bottom border is expected to go in the same direction as the prior trend. In this scenario, it is anticipated that BTC/USD would decline and remain below the crucial support levels of $20,000, $19,000, as well as $18,000.
Yet if the price of Bitcoin rises again above the 9-day as well as 21-day moving averages, it can reach the nearest resistance level of $24,000. The price may reach the resistance levels of $27,000, $28,000, or $29,000 with a sustained positive trend. RSI (14) is a technical indicator that is displaying negative movement, indicating that the marketplace may continue to decline.
While options traders remain confident despite downside risks, margin longs defend $24,000
As investors may leverage their digital currency positions by borrowing more cryptocurrencies, margin markets aid in understanding the stance of experienced traders in the market. Investors can, for instance, borrow bitcoin and take a long position to boost their exposure to bitcoin.
Between February 21 and February 23, Bitcoin’s margin lending ratio surged, showing that experienced traders were backing long positions when the price plummeted below $24,000. This supported the cost of the currency for a while, but doubts about increasing inflation rates quickly led to a decrease in price.
On the other hand, the 25% delta tilt indicates overcharging for downside or upside security by market makers, but options markets can assist in determining how risk-averse investors are. When fear rises, the signal changes from negative to positive. So, a 10% gain will portend a Bitcoin crash, and a 10% decrease will portend euphoria.
The aforementioned chart indicates executive interest in leveraged longs while indicating neutral risk evaluations from options traders. Notwithstanding the pressure from authorities, Bitcoin futures are holding up fairly well, pointing to a good prognosis for the cryptocurrency in the near future.
Bitcoin reaches a weekly low due to inflation anxiety
When the PCE Cost Index showed a disinflation tendency settling in January, market players were increasingly anticipating the US Treasury Department to increase its benchmark funds rate by fifty basis points the following month.
The cost index for January increased by 5.4% when compared to the previous year, which was significantly higher than experts’ predictions of a 5% increase. The PCE Cost Index surpassed forecasts regularly as well, rising 0.6% in January as opposed to the expected 0.5%.
The metric’s core rate, which does not include prices for energy and food, rose by 4.7% in Jan as compared to 4.6% in Dec. Their numbers were predicted to grow by 4.3%. Risky assets like cryptocurrencies saw a price reduction as a result of this revelation. Bitcoin originally declined by roughly $200 and then plummeted to $23,100. The token is currently testing $23,000, which would correspond to Bitcoin’s lowest price this week.
MicroStrategy and Coinbase are among the stocks in the cryptocurrency sector that are down by between 5 and 8%. At the time of writing, the S&P 500 futures were down 1.1% and the Nasdaq 100 contracts were down 1.72% on Saturday.
The Fed is currently employing personal consumption expenditure as its main inflation measure. The likelihood of inflation rising by 50 basis points, as compared to the prediction of twenty-five basis points in January, is increasing, leaving traders entirely split regarding the performance of cryptocurrencies in the near term.
Wrapping Up
If the price levels didn’t rise from the aforementioned resistance level, it was projected that the price of Bitcoin would move into a decline. If it had gained traction, bitcoin may have challenged $24,267 and moved toward $25,000.
If the cryptocurrency is to develop positive momentum, purchasers will need to burst through this level, according to price research on the token. Investors should anticipate a comeback once the cryptocurrency price passes its high from the 27th, which might erase this week’s losses.
Related Articles
Best Wallet - Diversify Your Crypto Portfolio
- Easy to Use, Feature-Driven Crypto Wallet
- Get Early Access to Upcoming Token ICOs
- Multi-Chain, Multi-Wallet, Non-Custodial
- Now On App Store, Google Play
- Stake To Earn Native Token $BEST
- 250,000+ Monthly Active Users
Join Our Telegram channel to stay up to date on breaking news coverage


