Join Our Telegram channel to stay up to date on breaking news coverage
Bitcoin (BTC) Price Prediction – January 10
Bitcoin (BTC) is facing acute resistance towards $8,100 but the downside is equally protected.
BTC/USD Long-term Trend: Bullish (Daily Chart)
Key levels:
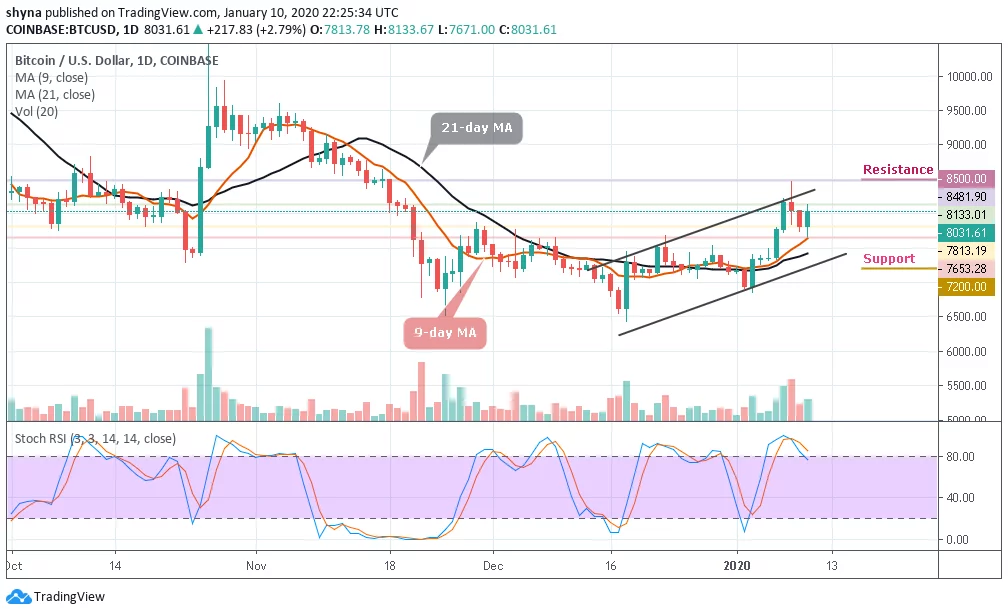
Resistance Levels: $8,500, $8,700, $8,900
Support Levels: $7,200, $7,000, $6,800
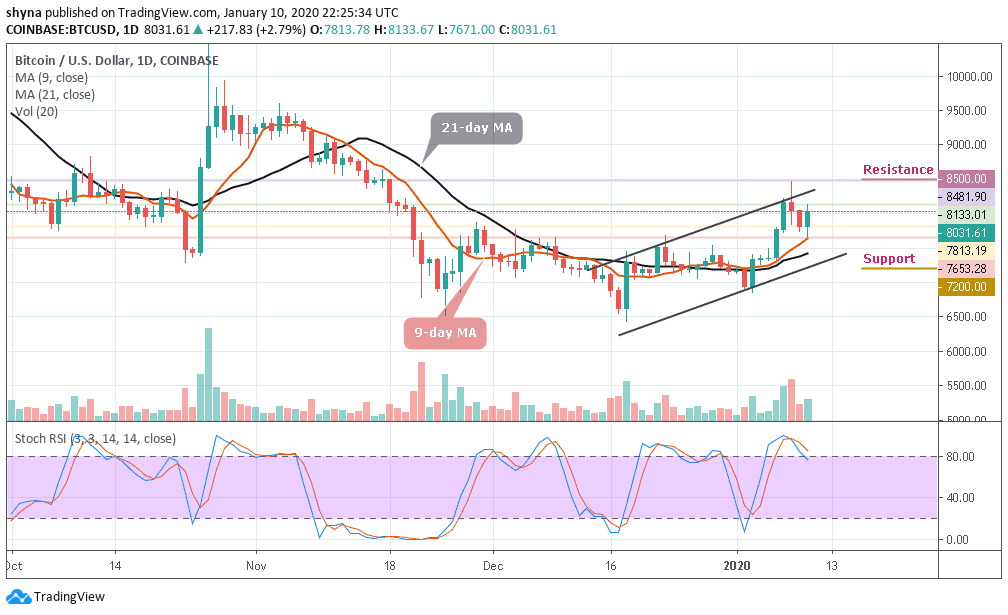
On the daily BTC/USD chart, we can see that price levels have rapidly declined to result in Bitcoin dropping over $400 within the space of 2days. Today, short-term price action has formed a wedge that has clearly broken to the upside. This has resulted in price levels attempting to continue the uptrend. Buying volume has yet to flood back into the market and will be required in order to sustain any form of a new uptrend.
Currently, the market price for BTC/USD and the daily candle is trading at $8,031 but if the bulls could push the price above the channel, the next resistance levels may be found at $8,500, $8,700 and $8,900. Typically when the new uptrends are beginning to form, traders will use both the 9-day and 21-day moving averages as the nearest support level.
However, any failure by the bulls to move the price up, we may see a price cut to $7,500 vital support. A further low drive could send the price to $7,200, $7,000 and $6,800 supports. For now, the bulls are still defending critical support. But as things stand, the BTC/USD price may likely reverse again because the stochastic RSI is about to recover from the overbought condition.
BTC/USD Medium-Term Trend: Bearish (4H Chart)
Looking at the 4-hour chart, the bears have been dominating the market for the past 2days, but the bulls have now stepped back into the market, trying to defend the $7,800 support. If not, the $7,700 and below may come into play if BTC breaks below the mentioned supports.
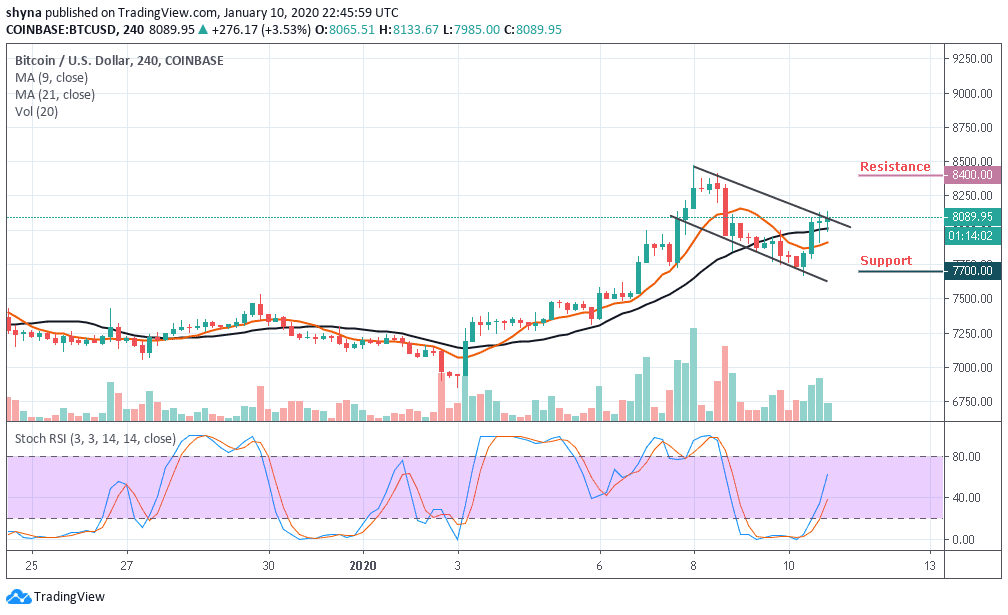
However, in as much as the buyers can reinforce and power the market, traders can expect a retest at $8,100 resistance level and breaking this level may further push the price towards the resistance level of $8,400 and above. The stochastic RSI has just recovered from the oversold zone, now moving above the 40-level.
Please note: Insidebitcoins.com is not a financial advisor. Do your research before investing your funds in any financial asset or presented product or event. We are not responsible for your investing results.
Join Our Telegram channel to stay up to date on breaking news coverage