Join Our Telegram channel to stay up to date on breaking news coverage
Bitcoin (BTC) Price Prediction – October 1
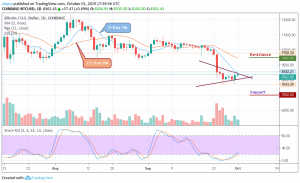
Bitcoin (BTC) has finally found some short-term relief from the bearish pressure that has seen the price levels drop from $9,788 to $7,693 within a few days.
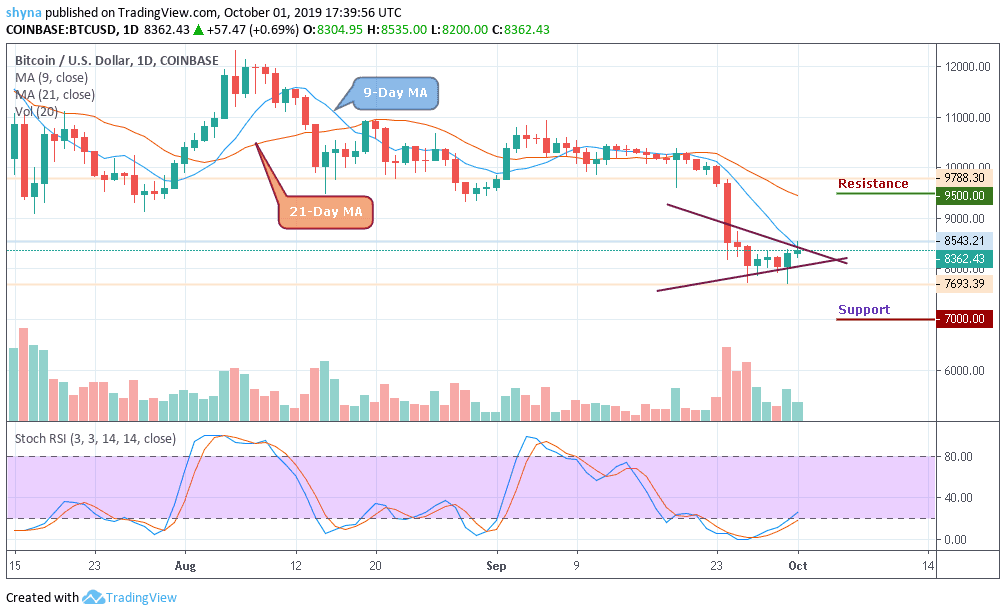
BTC/USD Long-term Trend: Bearish (Daily Chart)
Key levels:
Resistance Levels: $9,500, $10,000 $10,500
Support Levels: $7,000, $6,500, $6,000
On the daily BTC/USD chart, we can see that price levels have rapidly declined to result in Bitcoin dropping $2,000 within the space of a few days. Since then, short-term price action has formed a wedge that has clearly broken to the upside. This has resulted in price levels attempting to form a new uptrend. Buying volume has yet to flood back into the market and will be required in order to sustain any form of a new uptrend.
Currently, the market price for BTC/USD and the daily candle is trading at $8,362 but has already touched the 9-day Moving Average. The next resistance levels lies at $9,500, $10,000 and $10,500. Typically when the new uptrends are beginning to form, traders will use the 9-Day MA as a pivot resistance point to gauge the strength of the trend. When price levels rise above the 9-Day MA, this is a sign of sustainability and will likely result in a continuation of the newly formed trend.
However, should BTC price failed to move up; we may see a price cut to $7,500 vital support. A further low drive could send the price to $7,000, $6,500 and $6,000 supports. For now, the bulls are still defending critical support. But as things stand, the BTC/USD price is rising while the stochastic RSI is recovering from the oversold condition.
BTC/USD Medium-Term Trend: Ranging (4H Chart)
On the 4-hour chart, we can see that the bears have been stepping back into the market, but the bulls are trying to defend the $8,000 support as well. Meanwhile, the $7,700 and below may come in play if BTC breaks the mentioned supports.
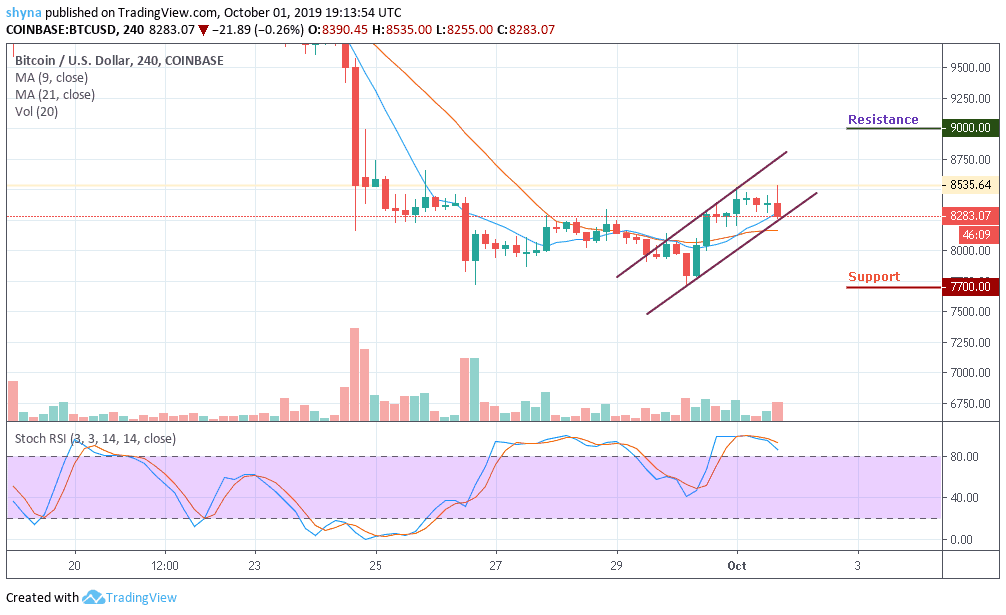
In as much as the buyers can reinforce and power the market, we can expect a retest at the $8,535 resistance level. Breaking the mentioned resistance may further allow the bulls to test the $9,000 and above on the upside but the stochastic RSI is at the overbought zone which may turn bearish when faces down.
Please note: Insidebitcoins.com is not a financial advisor. Do your research before investing your funds in any financial asset or presented product or event. We are not responsible for your investing results.
Join Our Telegram channel to stay up to date on breaking news coverage