Join Our Telegram channel to stay up to date on breaking news coverage
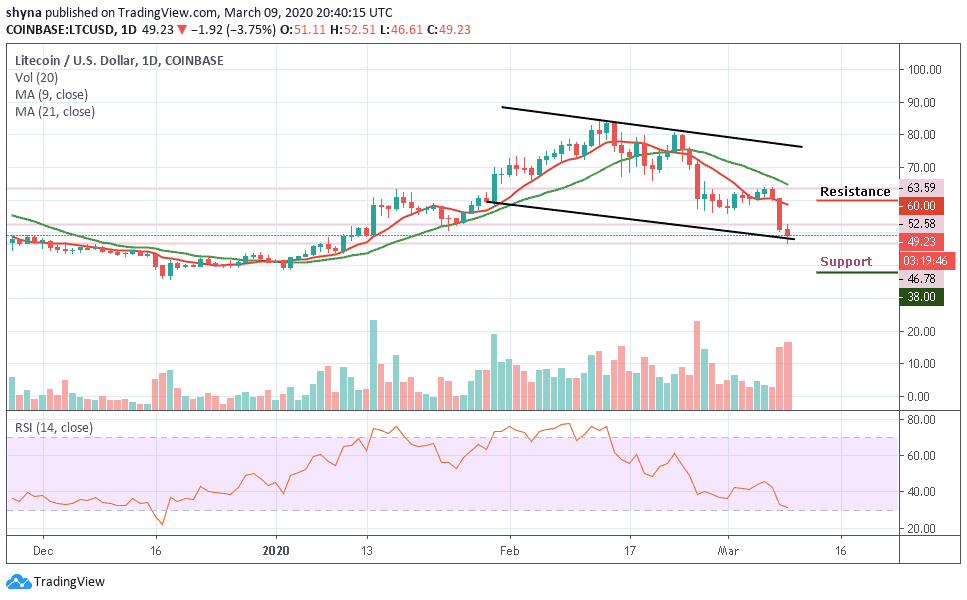
Bitcoin (BTC) Price Prediction – March 9
The daily chart reveals that Bitcoin (BTC) recovers from the intraday low of $7,622 while the upside momentum is nowhere to be found.
BTC/USD Long-term Trend: Bearish (Daily Chart)
Key levels:
Resistance Levels: $9,000, $9,200, $9,400
Support Levels: $6,800, $6,600, $6,400
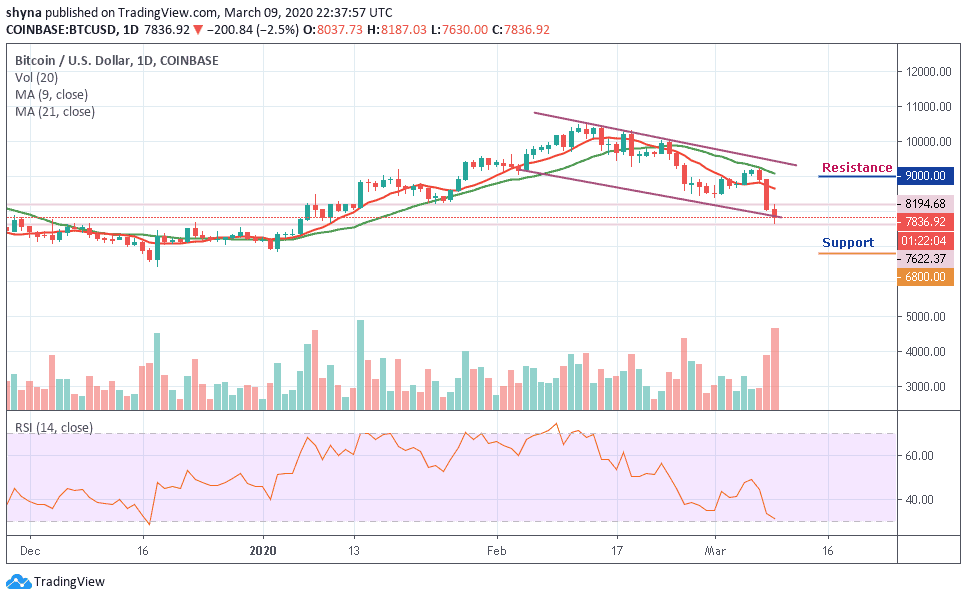
BTC/USD has been facing difficulties in maintaining its position above $8,000 the coin is in a dangerous position as the price slipped below the critical support level of $8,000 during early Asian hours. If the breakthrough is confirmed, the downward momentum may gain intensity with the next concentration on $7,500. At the time of writing, Bitcoin was trading below the moving averages of 9-day and 21-day at $7,836.92 with a decline of 2.5% on the daily price chart.
In addition, a crucial uptrend could probably form at the upper limit of the channel, with support close to $7,900 on the daily chart. However, if the decline occurs below the trend line, the price could extend its downward correction to the $7,500 level and any other loss could possibly push the price of Bitcoin to the support level of $7,300.
However, should BTC price failed to move up; we may see a price cut to $7,000 vital support. A further low drive could send the price to $6,800, $6,600 and $6,400 support levels while the resistance levels to watch are $9,000, $9,200 and $9,400. Nevertheless, BTC still maintains a bearish trend on the daily chart, with the RSI (14) moving around 32-level.
BTC/USD Medium – Term Trend: Bearish (4H Chart)
According to the 4-hour chart, the bears have dominated the market and the price has dropped far below the 9-day and 21-day moving averages heading towards the south. However, if the price breaks below the trend line of the descending channel and continues to fall, the support levels of $7,400 and below may come into play.
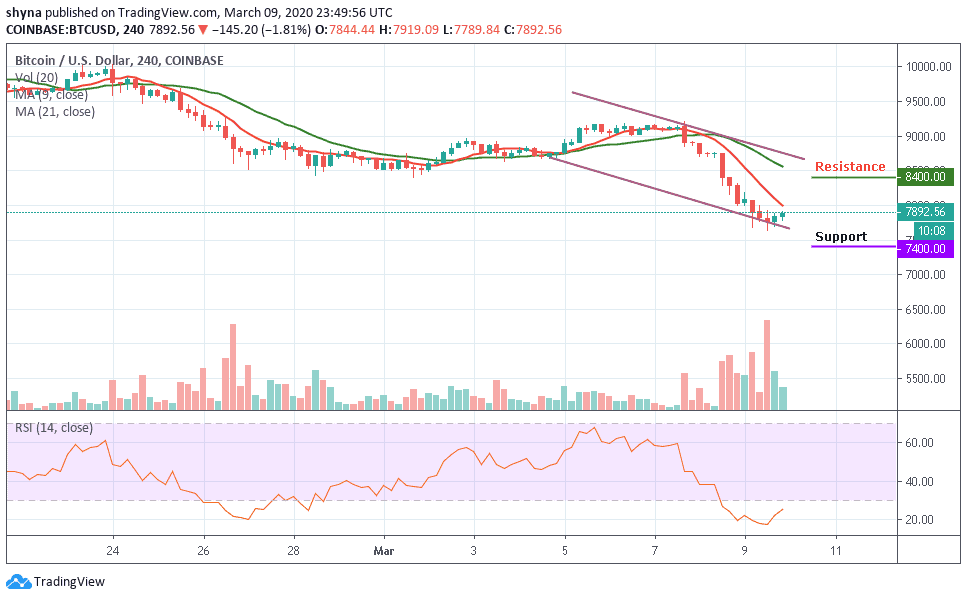
Meanwhile, as the RSI (14) is extremely at the oversold zone, on its way back to the top, the buyers would have gathered enough momentum to fuel the market and they may push the price above the 9-day moving average where it could hit the targeted resistance levels of $8,400 and above.
Please note: Insidebitcoins.com is not a financial advisor. Do your research before investing your funds in any financial asset or presented product or event. We are not responsible for your investing results.
Join Our Telegram channel to stay up to date on breaking news coverage