Join Our Telegram channel to stay up to date on breaking news coverage
Bitcoin (BTC) Price Prediction – June 24
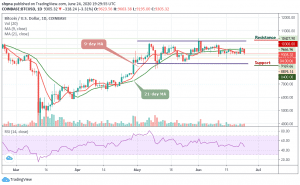
Bitcoin grinds laterally in a narrow range of $10,200 to $8,680 while the previous trend is expected to remain around $9,500.
BTC/USD Long-term Trend: Ranging (Daily Chart)
Key levels:
Resistance Levels: $10,300, $10,500 $10,700
Support Levels: $8,400, $8,200, $8,000
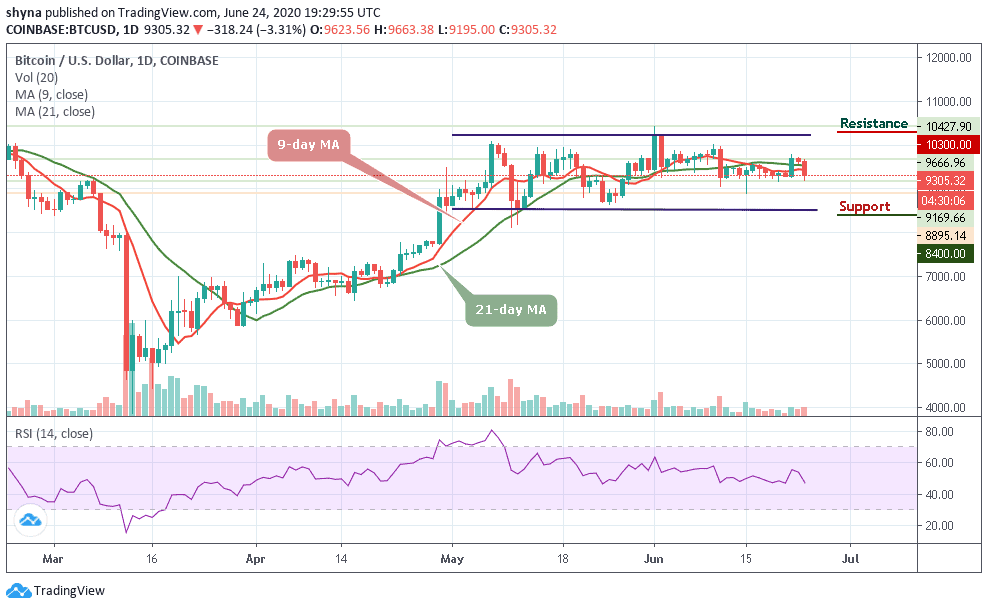
BTC/USD has been struggling to maintain its position above $9,600 and its price saw another dive below the $9,200 today to touch the daily low at $9,169.66. The coin is in a dangerous position as the price slipped below the critical support level of $9,400 during early Asian hours. If the breakthrough is confirmed, the downside momentum will gain traction with the next focus on $9,000. At the time of writing, Bitcoin is trading below the moving averages of 9-day and 21-day at $9,305.32 with a decline of 3.31% on the daily price chart.
Moreover, if we look at the price movement of BTC since the beginning of this month, we can see that the coin has been following a sideways movement in the past few weeks. BTC/USD started the month trading at $9,421 and reached a high of $10,427 before starting the downward journey. Early this movement, the highest recorded price of BTC was $10,427 and the coin is capable of moving past this value in the upcoming months.
Looking at the daily chart, the Bitcoin pair is moving sideways but should its price failed to move up; a further low drive could send the price to $8,400, $8,200, and $8,000 support levels while the resistance levels to watch are $10,300, $10,500, and $10,700. Meanwhile, the technical indicator RSI (14) nosedives below 55-level, suggesting more bearish signals into the market.
BTC/USD Medium-Term Trend: Ranging (4H Chart)
Looking at the 4-hour chart, the bears have been dominating the market tremendously, but the bulls are trying to defend the $9,200 support as well. Meanwhile, the $9,000 and below may come into play if BTC breaks below the mentioned supports.
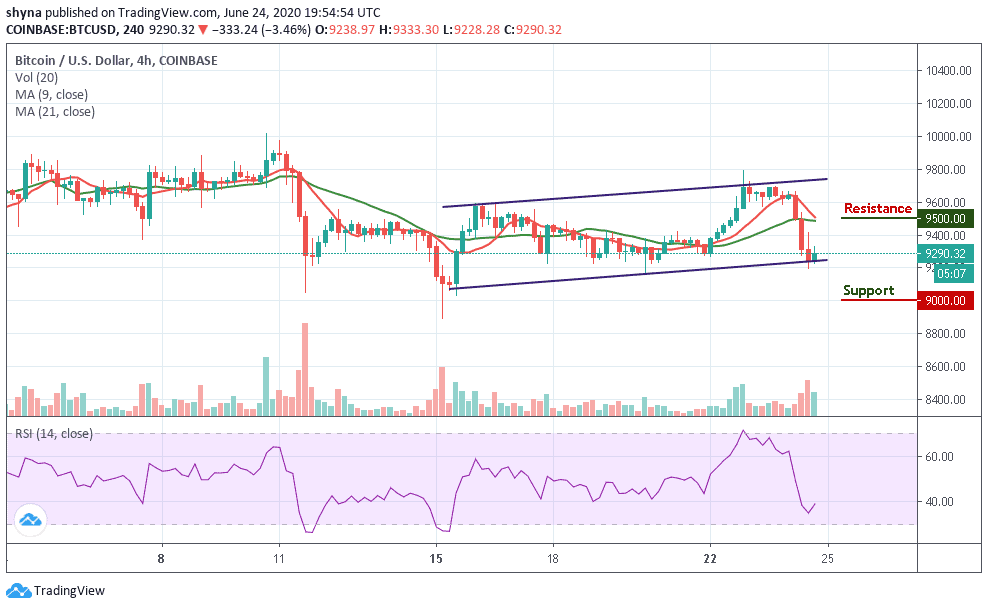
But in as much as the buyers can reinforce and power the market, traders can expect a retest at $9,400 resistance level, and breaking this level may further allow the bulls to reach $9,500 and above. The RSI (14) is facing up, crossing above the 40-level upward may introduce more bullish signals.
Join Our Telegram channel to stay up to date on breaking news coverage