Join Our Telegram channel to stay up to date on breaking news coverage
Bitcoin (BTC) Price Prediction – March 9
BTC/USD saw a 3.94% price collapse within 24-hours of trading as the cryptocurrency drops beneath $8,000.
BTC/USD Long-term Trend: Bearish (Daily Chart)
Key levels:
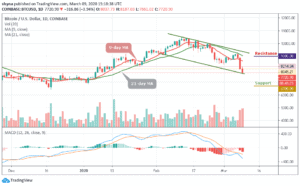
Resistance Levels: $9,000, $9,500, $10,000
Support Levels: $6,700, $6,200, $5,700
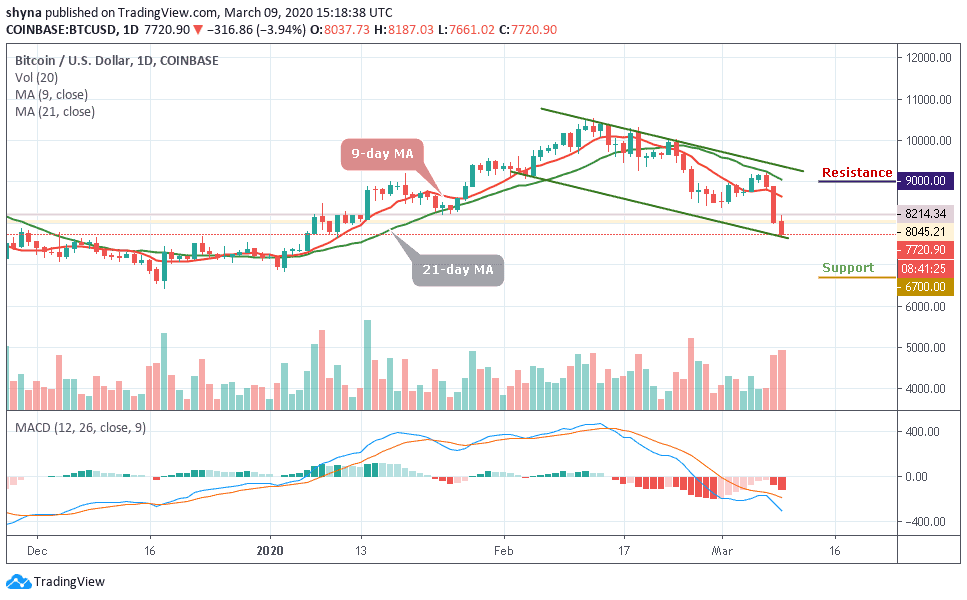
BTC/USD, over around a couple of days, has washed off all the gains that it managed over a little less than two months. The price of Bitcoin (BTC) broke below $8,000 during the early hours of trading and tested $7,789 support. At the moment, the top cryptocurrency is changing hands at $7,950. The Bitcoin (BTC) has lost over 18% since Friday amid massive sell-off on the cryptocurrency markets. In addition, BTC/USD is trading under the 9-day and 21-day moving averages.
More so, after moving close to $8,000 for three or four hours, the coin finally lost the support of $8,000, dipping as low as $7,720 at the time of writing. We can expect a rollback to the January 3 recovery area at $6,900 if the bears continue to step into the market. But before then, the $7,500 and $7,000 are the nearest key support levels, although this particular level may be tested in the nearest term.
Meanwhile, the $9,000, $9,500 and $10,000 levels are now presented as resistance for the market. On the intraday outlook, BTC is still following the bearish movement. A daily candle closes beneath the $7,500 could lead to a significant price drop while a further low drive could send the price to $6,700, $6,200 and $5,700 support. The technical indicator MACD remains within the negative side, which shows a possible more bearish momentum may continue to play out.
BTC/USD Medium – Term Trend: Bearish (4H Chart)
Looking at the 4-hour chart, the bears have been dominating the market tremendously, but the bulls are trying to defend the $7,700 support as well. Meanwhile, the $7,200 and below may come into play if BTC breaks below the mentioned support.
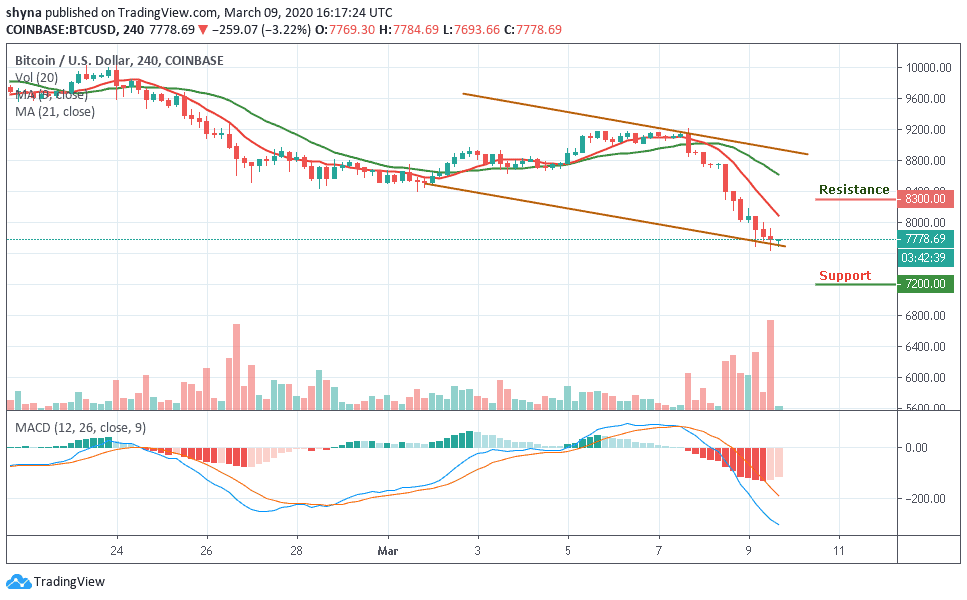
However, in as much as the buyers can reinforce and push the market towards the north, traders can expect a retest at $8,000 resistance level and breaking this level may further allow the bulls to reach $8,300 and above. Nevertheless, the technical indicator is still on the negative side, which indicates more bearish signals.
Please note: Insidebitcoins.com is not a financial advisor. Do your research before investing your funds in any financial asset or presented product or event. We are not responsible for your investing results.
Join Our Telegram channel to stay up to date on breaking news coverage