Join Our Telegram channel to stay up to date on breaking news coverage
Bitcoin (BTC) Price Prediction – August 15, 2020
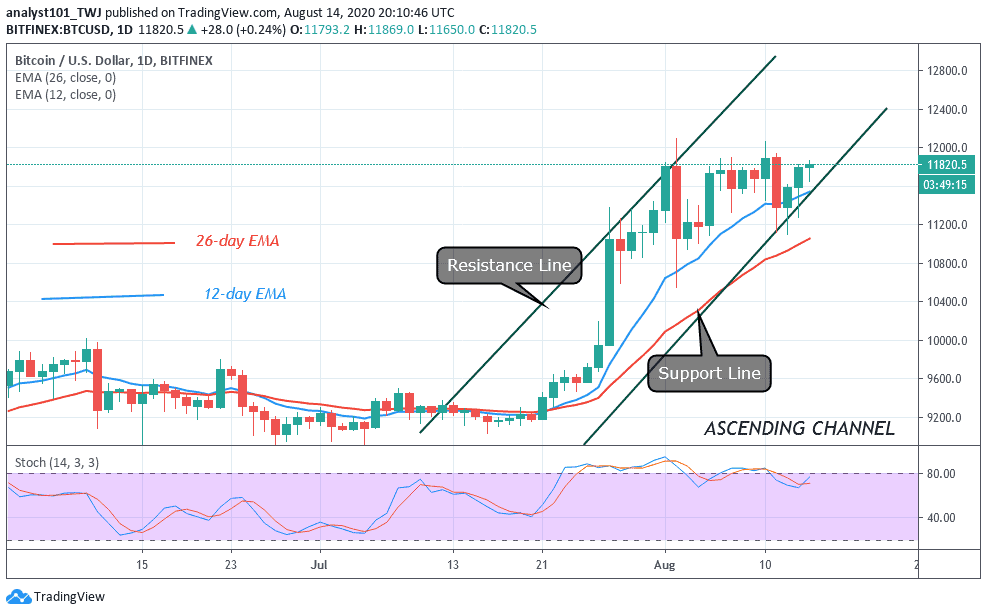
Today, BTC/USD pushed price to $11,997 and was repelled. The king coin retraced to $11,899 and shows signs of further selling pressure. However, the price action of last weekend may repeat itself. Last weekend, the king coin surged past the $12,000 but suddenly fell to the middle of the price range.
Resistance Levels: $10,000, $11, 000, $12,000
Support Levels: $7,000, $6,000, $5,000
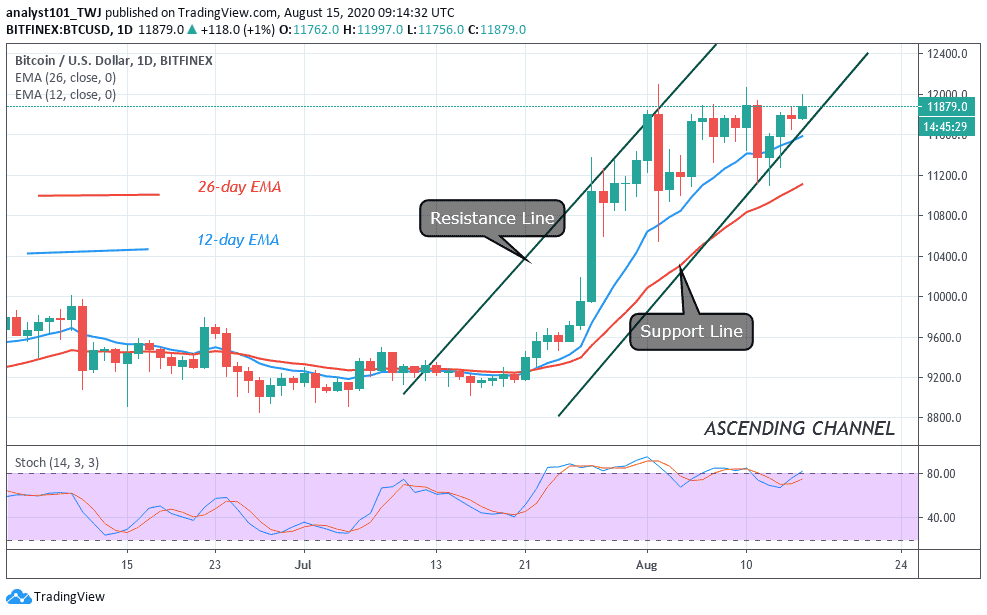
Today, after the initial resistance from the recent high, price is fluctuating between $11,800 and $12,000. On the upside, for BTC to reach its first target price of $13,000, buyers must clear the resistance levels of $11,800 and $12000. In other words, the bulls must clear the resistance between $11,950 and $12,050. This will ensure price acceleration on the upside. On the other hand, if buyers fail to push above the resistance, the coin will be compelled to retrace. If the market retraces to $11,700, the selling pressure will continue to $11,100 or $11,250. However, if these levels are broken, BTC will further depreciate to $10,400. The consequence is that there will be a change in trend.
Institutional Investors Buy Bitcoin as a Hedge Against Business Failures
A firm like MicroStrategy has purchased $250 million BTC as a hedge against unforeseen failures in the mainstream of equities market. This recent development has spread to Wall Street firms seizing the opportunity to hold Bitcoin as a hedge against sudden business failures. This is on the backdrop of Coronavirus pandemic plaguing the economies around the globe. Most investors are looking towards haven assets like BTC and gold.
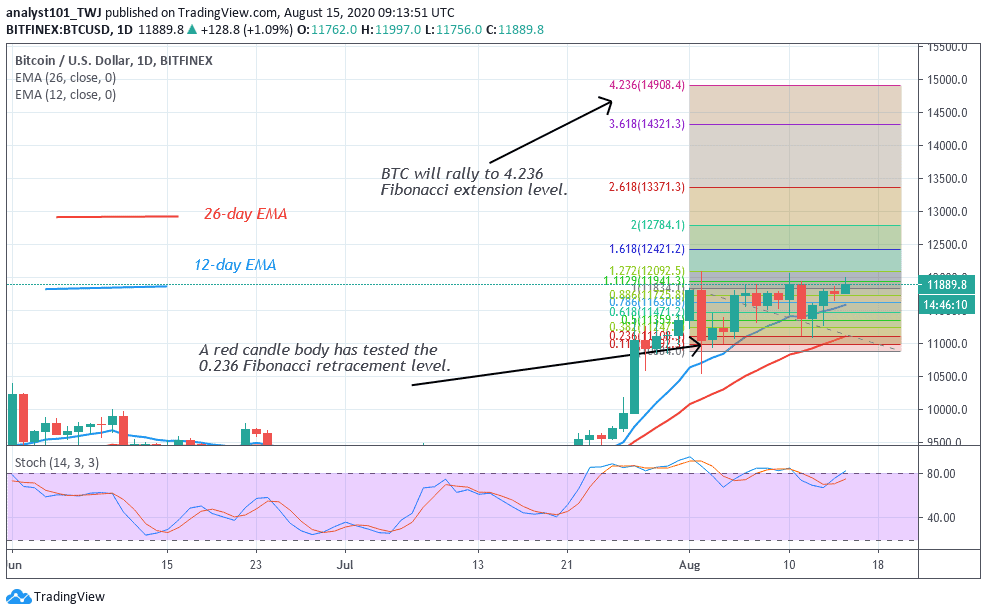
Nonetheless, the BTC price has continued to fluctuate above $11,800 as it retests the $12,000 overhead resistance. The Fibonacci tool is still maintaining the same reading. A large candle body tested the 0.236 Fibonacci retracement level. This indicates the upward move of Bitcoin to 4.236 Fibonacci extension level or the high of $15,000.
Join Our Telegram channel to stay up to date on breaking news coverage