Join Our Telegram channel to stay up to date on breaking news coverage
Bitcoin Price Prediction – October 27
Variant trades that have taken place in the recent BTC/USD trade operations have changed into a trading scenario that has caused BTC to surge to a high point over the psychological $20,000 region. Price is trading with a 0.94% negative bias towards $20,575.75 inside the $20,871.95 and $20,440.52 high and low-value lines.
BTC/USD Market
Key Levels:
Resistance levels: $22,500, $25,000, $27,500
Support levels: $17,500, $15,000, $12,500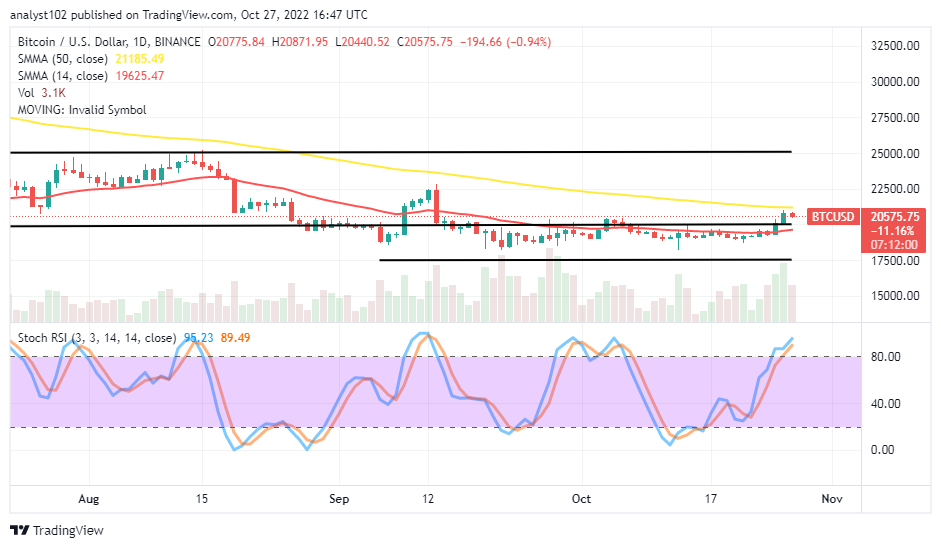 BTC/USD – Daily Chart
The daily chart reveals the BTC/USD market operation continues to rise in its valuation to the point of the bigger SMA indicator. The 14-day SMA indicator is at $19,625.47 value-line underneath the 50-day SMA indicator. The first lower horizontal line is long-drawn at the $20,000 psychological level and is above the second lower counterpart at the $17,500 support level. The Stochastic Oscillators have moved into the overbought region, maintaining 89.49 and 95.23 range values. Currently, the motion on the candlestick carries a bearish outlook.
Should buyers opt for new longing orders at this point of trading capacity level in the BTC/USD market?
It is psychologically not ideal for the BTC/USD market buyers to open fresh longing orders at the current BTC/USD trade activity even though the crypto’s price continues to rise to a high spot around the trend line of the 50-day SMA indicator. It shows bulls in the market are pushing northward lightly against resistances around the $22,500 value line. The occurrence of a fully grown bullish candlestick above the point of the bigger SMA trend line may systemically advance valuation to the previous higher resistance zone at $25,000.
On the downside of the technical analysis, the trading points around the 50-day SMA and the $22,500 resistance level will serve as zones where sellers to get a good selling order. Traders may also lookout for set-ups on a 1-hour and 4-hour charts, coming to an agreement that indicates an overbought reading condition before taking a shorting position order afterward.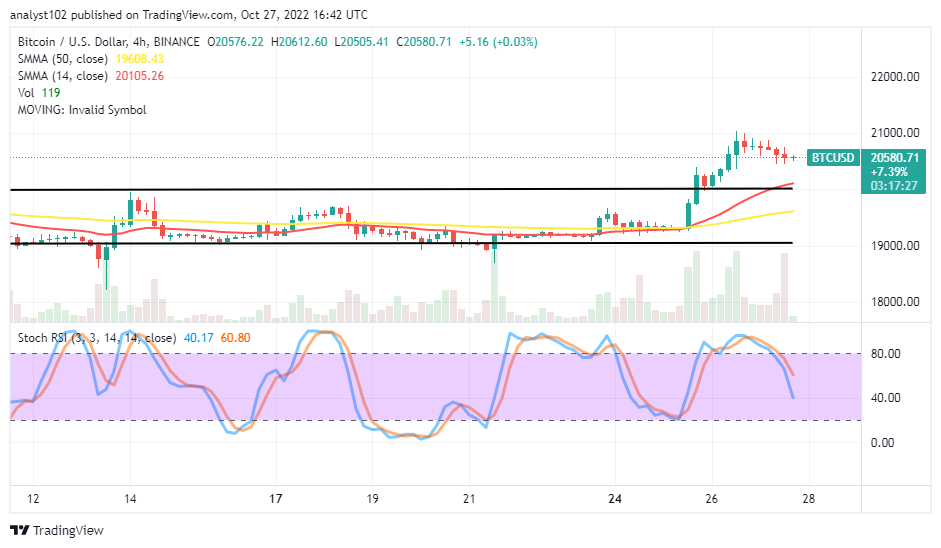
BTC/USD 4-hour Chart
The BTC/USD medium-term chart showcases that the BTC market operation continues to rise to hit resistance around the $21,000 level over the trend lines of the SMAs. The 14-day SMA indicator is at a $20,105.26 value line $19,608.43 point of the 50-day SMA indicator. The outcome of the current Stochastic Oscillators reading shows they have crossed southbound from the overbought region to 60.80 and 40.17 range values. Currently, it appears the market has found a barrier under or around the point mentioned at the beginning of this analytics paragraph that bears will have to be held firmly against buying forces.
The Dash 2 Trade presale is off to an excellent start, having already raised more than $2 million in just a few days. The initial cost was a mere $0.0476, while the current price is $0.05.The price will increase again to $0.0513 at the third stage of the presale.
Related
- D2T Price Prediction
- How to Buy D2T Token
Join Our Telegram channel to stay up to date on breaking news coverage