Join Our Telegram channel to stay up to date on breaking news coverage
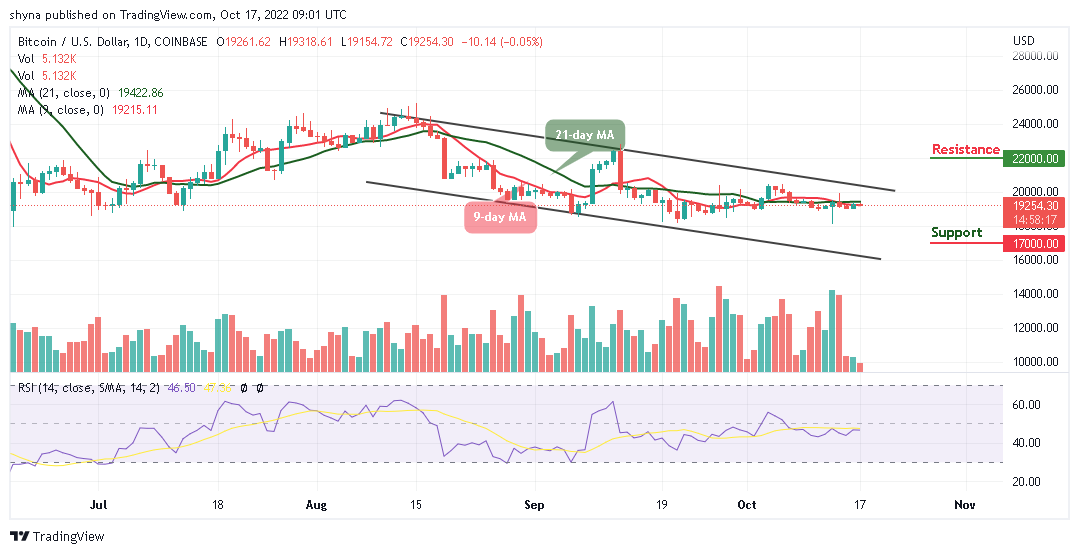
The Bitcoin (BTC) price prediction indicates bearish momentum as the coin remains below the 9-day and 21-day moving averages.
Bitcoin Prediction Statistics Data:
- Bitcoin price now – $19,254
- Bitcoin market cap – $371.3 billion
- Bitcoin circulating supply – 19.1 million
- Bitcoin total supply – 19.1 million
- Bitcoin Coinmarketcap ranking – #1
BTC/USD Long-term Trend: Ranging (Daily Chart)
Key levels:
Resistance Levels: $22,000, $23,000, $24,000
Support Levels: $17,000, $16,000, $15,000
Your capital is at risk
BTC/USD is at the moment trading at $19,254, but the king coin continues to consolidate below the 9-day and 21-day moving averages. At the moment, the Bitcoin price may continue with the sideways movement, but the daily chart shows that the formation of a bearish movement is likely to come to play.
Bitcoin Price Prediction: BTC Price May Consolidates to the Downside
As the Bitcoin price remains below the 9-day and 21-day moving averages, BTC/USD is likely to head toward the lower boundary of the channel. This could mean that the king coin is not yet ready for the upside until the red line of the 9-day moving average crosses above the green line of the 21-day moving average. Similarly, the technical indicator Relative Strength Index (14) is moving in the same direction, suggesting sideways movement.
From the upside, recovery may not come easy as the sellers could bring the king coin towards the lower boundary of the channel. Meanwhile, a sustainable move above the 9-day and 21-day moving averages may push the coin above the upper boundary of the channel, which may allow for an extended recovery toward the potential resistance levels at $22,000, $23,000, and $24,000. However, an increase in selling pressure may bring the Bitcoin price towards the supports at $17,000, $16,000, and $15,000.
BTC/USD Medium-term Trend: Ranging (4H Chart)
Looking at the 4-hour chart, the Bitcoin price is trading above the 9-day and 21-day moving averages. BTC/USD may remain above the 9-day MA as the market is trying to recover from the bearish momentum. However, if the price stays above the moving averages and moves to cross above the upper boundary of the channel, the resistance level could be located at $20,000 and above.
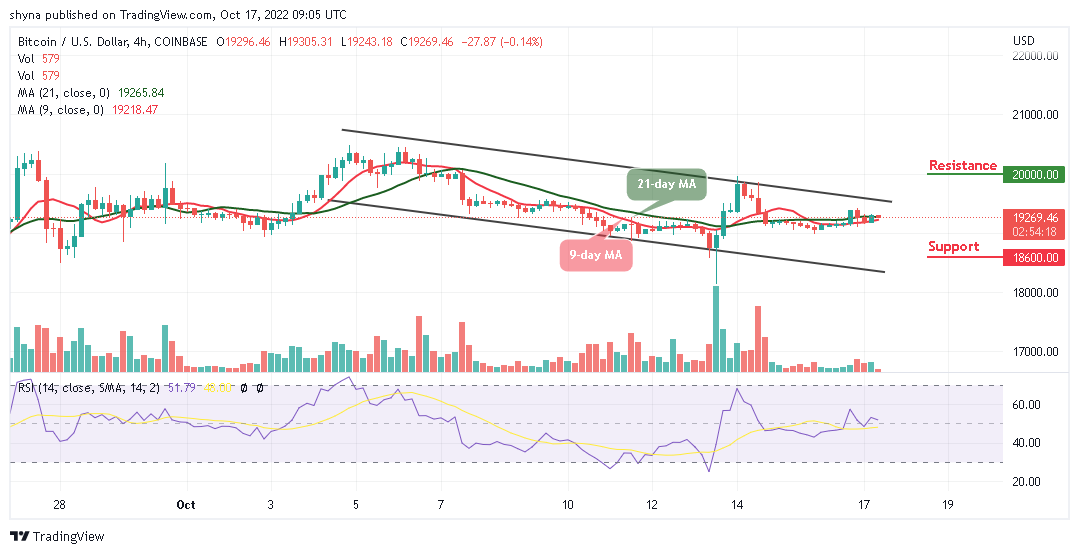
On the contrary, the technical indicator Relative Strength Index (14) is likely to cross below the 50-level. Moreover, if the sellers increase the bearish movement, the support level of $19,000 may not be able to hold the selling pressure. Therefore, BTC/USD is likely to fall to the critical support level of $18,600 and below.
Join Our Telegram channel to stay up to date on breaking news coverage