Join Our Telegram channel to stay up to date on breaking news coverage
The Bitcoin price prediction gains 2.11% as bulls keep working hard on BTC to nurture a bullish trend towards the resistance level of $20k.
Bitcoin Prediction Statistics Data:
- Bitcoin price now – $19,787
- Bitcoin market cap – $378.1 billion
- Bitcoin circulating supply – 19.1 million
- Bitcoin total supply – 19.1 million
- Bitcoin Coinmarketcap ranking – #1
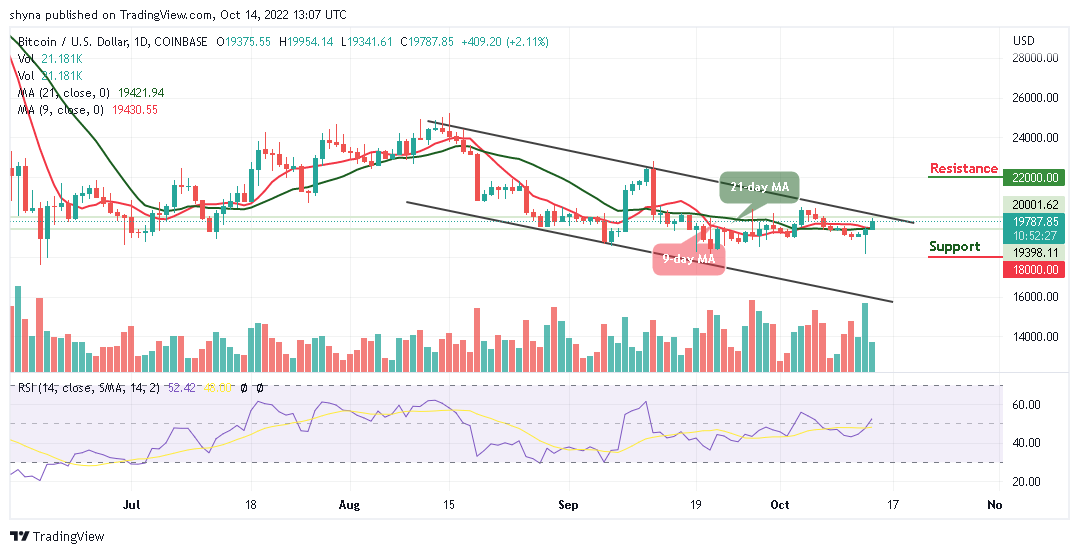
BTC/USD Long-term Trend: Bearish (Daily Chart)
Key levels:
Resistance Levels: $22,000, $24,000, $26,000
Support Levels: $18,000, $16,000, $14,000
Your capital is at risk
BTC/USD is hovering at the $19,787 resistance level as the market price stays above the 9-day and 21-day moving averages, indicating a bullish movement. For the past few days, the Bitcoin price has been moving positively and in the context of the Bitcoin exchange rate forecast; an application of $20,000 resistance is expected.
Bitcoin Price Prediction: Will BTC Break Above $20k?
If the Bitcoin price can cross above the resistance level of $20,000, it is likely for the market price to touch the potential resistance of the $21,000 level. This is where traders should expect buyers to fight for a further rise in BTC/USD and further development of the bullish trend. Meanwhile, looking at the market movement, there is likely that the Bitcoin price may experience a quick retracement or sell-off just in case it touches the crucial $20,000 resistance level.
However, any further bullish movement could hit the resistance level of $22,000, $24,000, and $26,000 respectively. On the downside, if the market decides to cross below $19,000 support, BTC/USD could head towards the lower boundary of the channel, and it could see a further decline towards the support levels of $18,000, $16,000, and $14,000. As revealed by the technical indicator, the market may gain more if the Relative Strength Index (14) stays above the 50-level.
BTC/USD Medium-term Trend: Ranging (4H Chart)
On the 4-hour chart, the Bitcoin price is bullish and it could cross above the upper boundary of the channel if the bullish pressure increases. On the contrary, if the selling pressure returns to the market and holds the coin does not follow the upward movement, $19,000 and below may come into play.
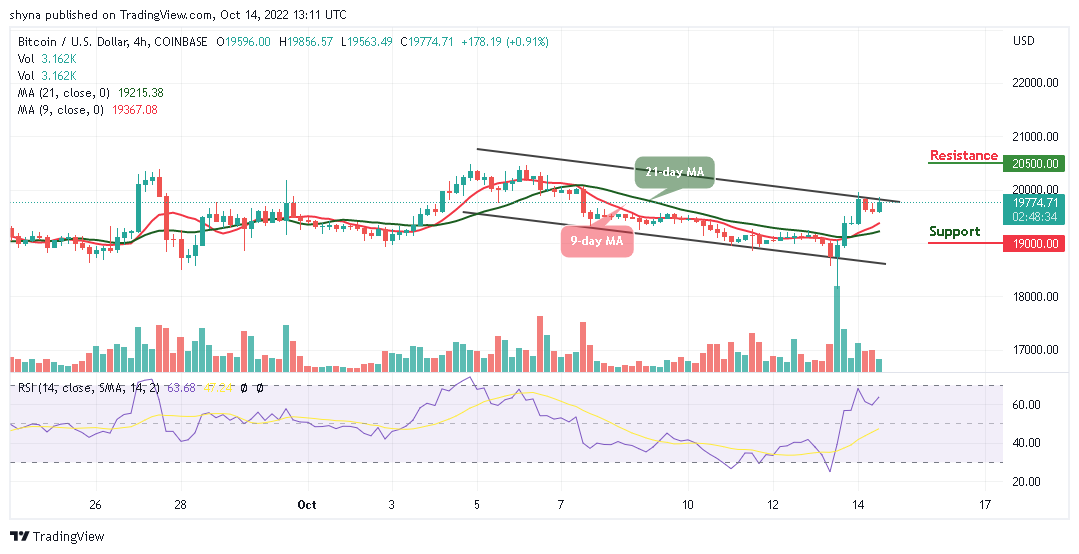
However, in as much as the buyers keep the price above the 9-day and 21-day moving averages, traders may expect a strong bullish movement that could hit the resistance at $20,500 and above. Meanwhile, the technical indicator Relative Strength Index (14) is above the 60-level, suggesting that more bullish signals may play out.
Join Our Telegram channel to stay up to date on breaking news coverage