Join Our Telegram channel to stay up to date on breaking news coverage
The Bitcoin price prediction shows that BTC bulls’ comeback is likely to send the price toward the resistance level of $30,000.
Bitcoin Prediction Statistics Data:
- Bitcoin price now – $28,962
- Bitcoin market cap – $558.9 billion
- Bitcoin circulating supply – 19.3 million
- Bitcoin total supply – 19.3 million
- Bitcoin Coinmarketcap ranking – #1
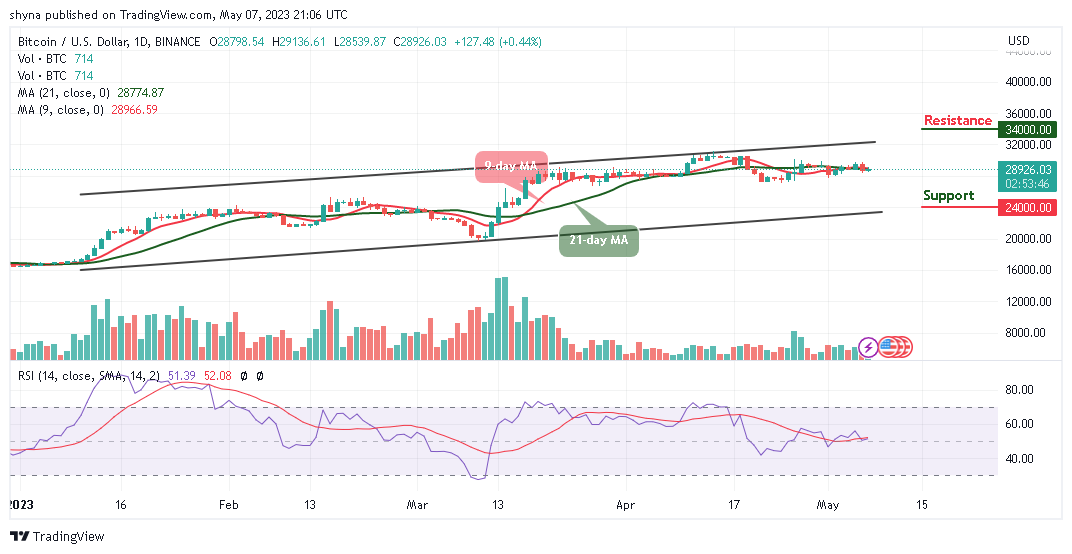
BTC/USD Long-term Trend: Ranging (Daily Chart)
Key levels:
Resistance Levels: $34,000, $36,000, $38,000
Support Levels: $24,000, $22,000, $20,000
The daily chart shows that BTC/USD is recovering from the support level of $28,500 following a bearish correction. Today, the European session is characterized by a renewed upward trend whereby BTC/USD has recovered from intraday lows to trade around $28,952. Moreover, the Bitcoin price is currently hovering at 0.44% higher on the day as the king coin moves within the 9-day and 21-day moving averages.
Bitcoin Price Prediction: Bitcoin (BTC) Needs to Move Above $30k
The Bitcoin price is yet to trade below the 9-day and 21-day moving averages. Therefore, the first digital asset is now moving sideways. On a bullish note, the Relative Strength Index (14) shows that the signal line is likely to remain above the 50-level, suggesting that the Bitcoin price will once again move to touch the $30,000, which is the potential resistance level.
However, a strong bullish movement may push the coin above the 9-day and 21-day moving averages, this could take the price to the resistance levels of $34,000, $36,000, and $38,000. Meanwhile, if the market makes a quick turn to the south, BTC/USD may likely cross below the support level of $28,000, and should this support fails to contain the sell-off, traders may see a further drop to the support levels of $24,000, $22,000, and critically $20,000.
BTC/USD Medium-term Trend: Ranging (4H Chart)
Following the 4-hour chart, Bitcoin (BTC) is now trading at around $28,932. Although the Bitcoin price has not yet crossed below $28,000 support, it’s still in the loop of making a reversal. However, the Bitcoin price hovers within the 9-day and 21-day moving averages and may take time to persistently trade above this barrier.
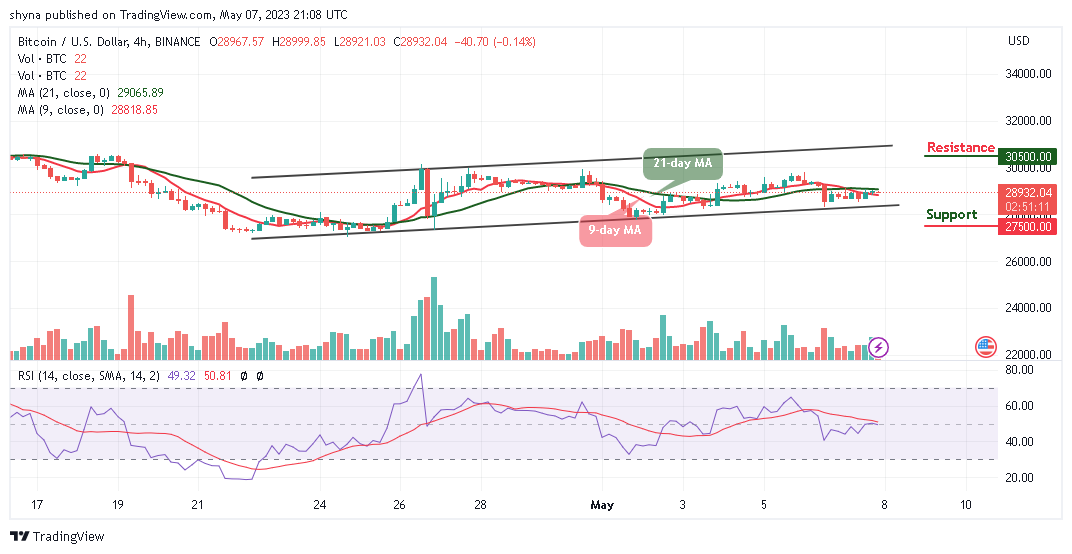
At the moment, BTC/USD is currently moving sideways while the technical indicator Relative Strength Index (14) moves in the same direction above the 50-level. Meanwhile, the upward movement may likely cause the coin to hit the nearest resistance level at $30,500 and above while the immediate support lies at $27,500 and below.
Bitcoin Alternatives
After a slightly positive move above the resistance level of $29,100 during the European session today, the Bitcoin price is likely to reverse from the current market value and cross above the 9-day and 21-day moving averages. Over the past few days, the king coin has been struggling to break above the upper boundary of the channel. Moreover, AiDoge’s generator uses cutting-edge artificial intelligence algorithms to create contextually relevant memes, trained on extensive meme datasets and crypto news. However, this guarantees up-to-date and high-quality memes as almost $4m has been raised in ongoing presale.
Join Our Telegram channel to stay up to date on breaking news coverage