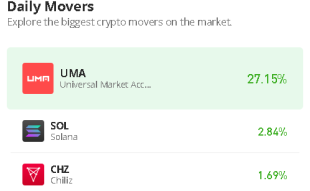
Join Our Telegram channel to stay up to date on breaking news coverage
After touching the daily high of $29,808, the Bitcoin price prediction is down to touch a low of $28,310; a quick recovery seems possible for now.
Bitcoin Prediction Statistics Data:
- Bitcoin price now – $28,912
- Bitcoin market cap – $559.8 billion
- Bitcoin circulating supply – 19.3 million
- Bitcoin total supply – 19.3 million
- Bitcoin Coinmarketcap ranking – #1
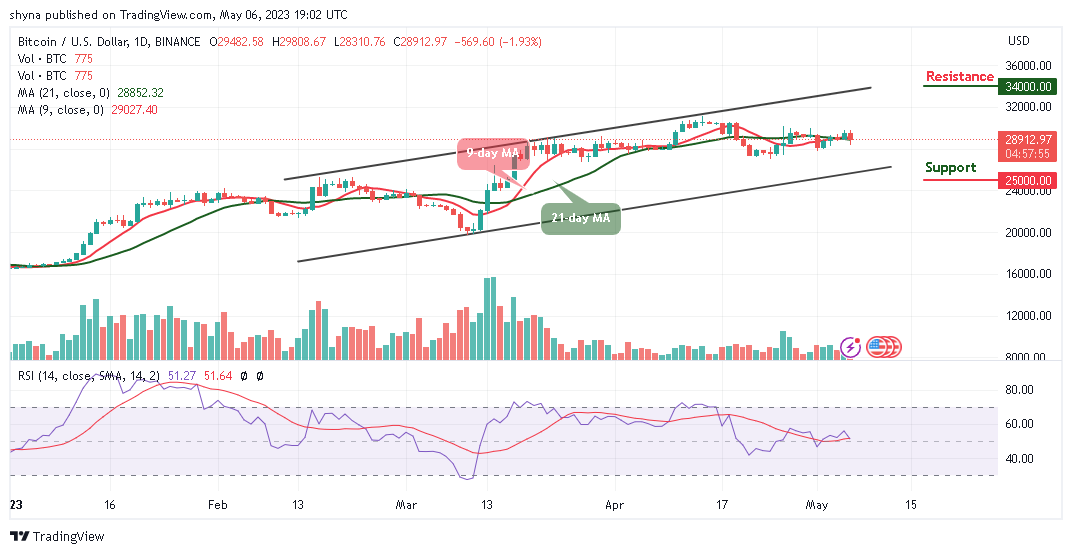
BTC/USD Long-term Trend: Ranging (Daily Chart)
Key levels:
Resistance Levels: $34,000, $36,000, $38,000
Support Levels: $25,000, $23,000, $21,000
After forming a short-term top, BTC/USD price slides and crosses below the 9-day and 21-day moving averages as the price consolidates around $28,912, with a few bearish signals. However, the recent correction to the upward failed near the $30,000 level and it seems like Bitcoin bulls are struggling to gain momentum above this level.
Bitcoin Price Prediction: Would Bitcoin Head to the Downside?
The Bitcoin price is currently hovering within the 9-day and 21-day moving averages, the $28,000 and $26,000 levels are initial supports if the coin heads to the downside. However, if the bulls fail to recover the recent high of $29,808, there is a risk of a sharp decline. However, if the bears drag the price below the lower boundary of the channel, then, Bitcoin (BTC) could drop to the critical supports of $25,000, $23,000, and $21,000 respectively.
Nevertheless, if there is a clear break toward the upper boundary of the channel, the Bitcoin price could hit the $30,000 resistance level. If the bulls manage to gain strength above $31,000, there are chances of a decent recovery toward the $32,000 resistance area. Moreover, the key breakout zone is near the $34,000, $36,000, and $38,000 resistance levels. Meanwhile, the Relative Strength Index (14) for the king coin is likely to cross below the 60-level, suggesting a bearish movement.
BTC/USD Medium-term Trend: Ranging (4H Chart)
The Bitcoin price is at the moment hovering below the 9-day and 21-day moving averages, trading at $28,845. Therefore, if the price drops below the lower boundary of the channel, it could reach the support level of $27,000 and below.
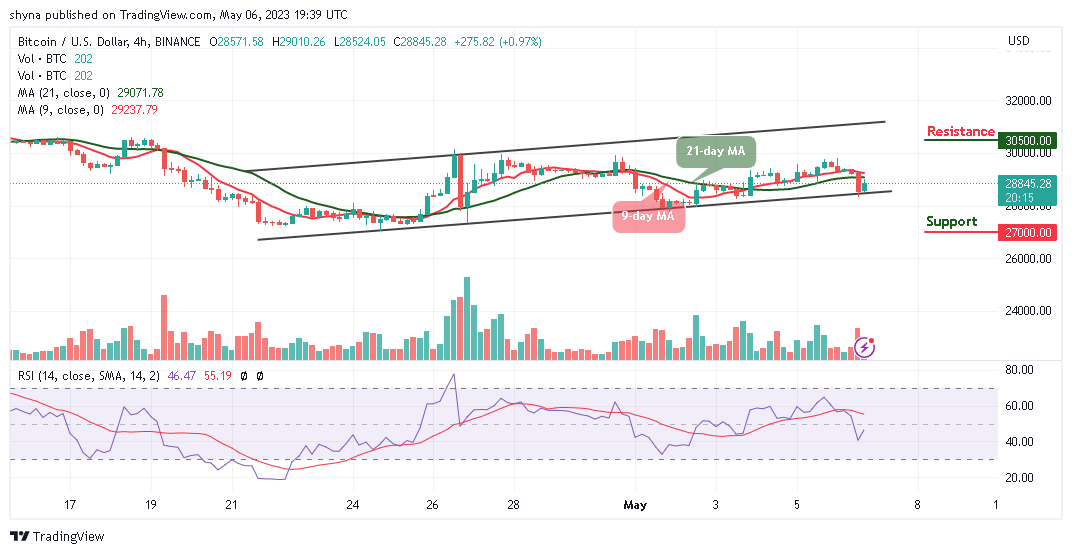
Nevertheless, if the bulls push the coin toward the upper boundary of the channel, the Bitcoin price may likely hit the potential resistance levels of $30,500 and below. At the moment, the market is ranging as the Relative Strength Index (14) indicator prepares to cross above the 50-level.
Alternatives to Bitcoin
The Bitcoin price could begin another decline if bulls failed to push the coin to the upside. At the opening of today’s trading; the king coin touches the resistance level of $29,010, but any bearish movement to the south may bring the coin down to the bearish zone. However, the AiDoge (AI) platform provides an AI-driven meme generation experience for users, adapting to the ever-changing crypto world. This employs advanced AI technology for creating relevant memes based on user-provided text prompts. Meanwhile, the key aspects include the AI-powered meme generator, text-based prompts, and $AI tokens for purchasing credits. Moreover, the token is currently at the presale stage raising almost $4m.
Join Our Telegram channel to stay up to date on breaking news coverage