Join Our Telegram channel to stay up to date on breaking news coverage
The Bitcoin price prediction is currently moving bearishly and seems to be preparing for the next move below the support level of $26,000.
Bitcoin Prediction Statistics Data:
- Bitcoin price now – $26,401
- Bitcoin market cap – $509.1 billion
- Bitcoin circulating supply – 19.3 million
- Bitcoin total supply – 19.3 million
- Bitcoin Coinmarketcap ranking – #1
BTC/USD Long-term Trend: Ranging (Daily Chart)
Key levels:
Resistance Levels: $32,000, $34,000, $36,000
Support Levels: $21,000, $19,000, $17,000
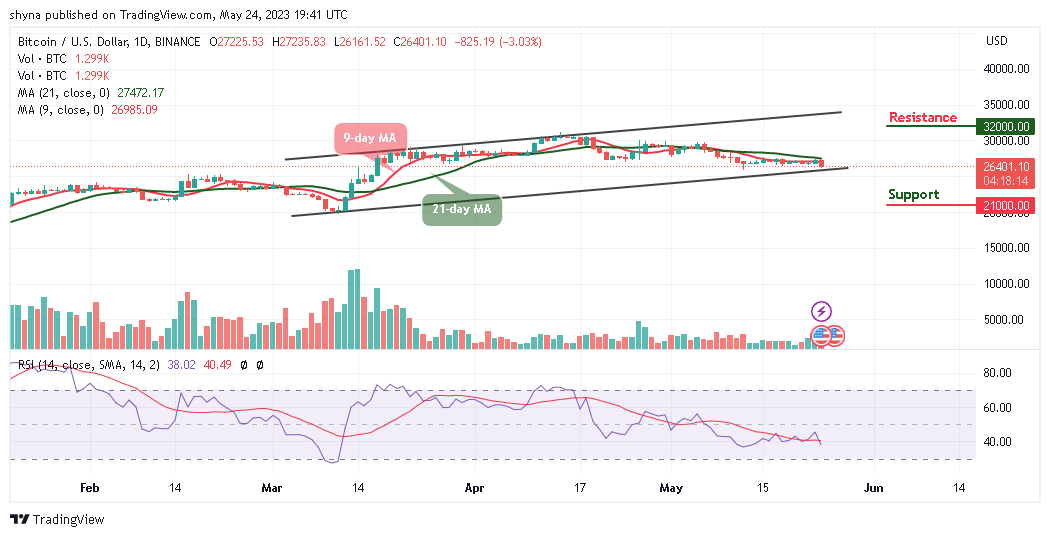
BTC/USD is seen hovering at $26,401, with the current consolidation pattern, the king coin remains below the 9-day and 21-day moving averages. Though Bitcoin (BTC) begins the day off intending to trend higher but couldn’t. Meanwhile, any bullish cross above the 9-day and 21-day moving averages could hit the nearest resistance level of $27,500. Meanwhile, any bearish cross below the lower boundary of the channel could locate the first level of support at $26,000. Beneath this, other supports could be below found at $21,000, $19,000, and $17,000.
Bitcoin Price Prediction: Bitcoin (BTC) May Face the Downside
The Bitcoin price is sliding toward the lower boundary of the channel as the technical indicator Relative Strength Index (14) moves to cross below the 40-level. On the next positive move, BTC could break to the upside as the candle is still yet to close. Meanwhile, if the bulls push the king coin to the north, the potential resistance levels could be found at $32,000, $34,000, and $36,000.
BTC/USD Medium-term Trend: Bearish (4H Chart)
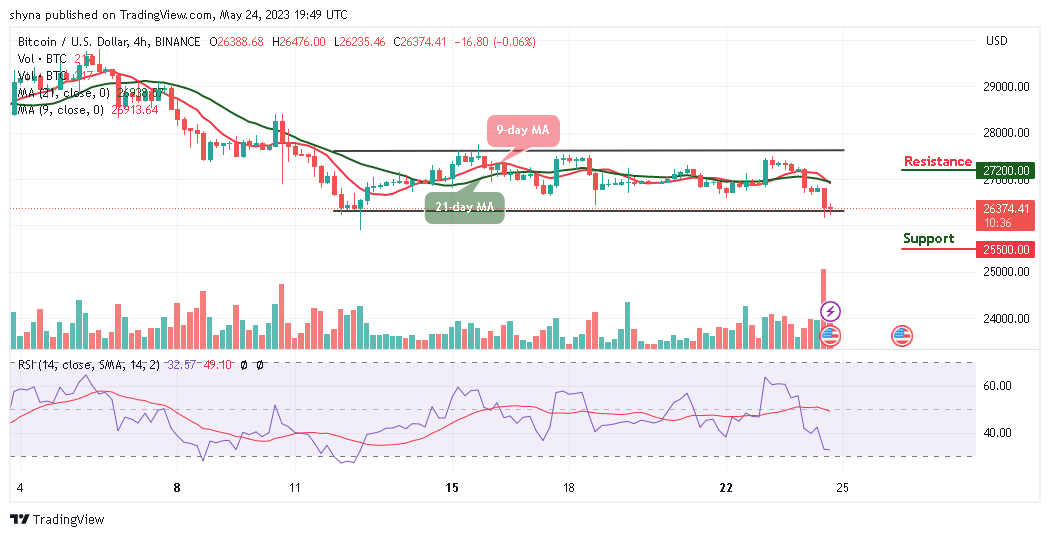
On the 4-hour chart, BTC/USD may need to cross above the 9-day and 21-day moving averages and move toward the upper boundary of the channel to mitigate the short-term bearish pressure so that it can reclaim the $27,000 level. Nonetheless, this psychological barrier may be closely followed by the resistance level of $25,500 and above.

On the contrary, if the king coin heads to the downside, the nearest support may come at $26,000, and a sustainable bearish movement could increase the downside pressure and bring the price toward $25,500 and below. Considering the technical indicator Relative Strength Index (14) on the 4-hour chart, the coin is likely to move sideways as the signal line moves in the same direction.
Bitcoin Alternatives
The Bitcoin price could begin another decline if bulls failed to push the coin to the upside. At the opening of today’s trading; the king coin could not cross above the 9-day and 21-day moving averages, but headed toward the lower boundary of the channel. Meanwhile, any bearish movement to the south may bring the coin down to the bearish zone. However, the AiDoge (AI) platform provides an AI-driven meme generation experience for users, adapting to the ever-changing crypto world. This employs advanced AI technology for creating relevant memes based on user-provided text prompts. Meanwhile, the key aspects include the AI-powered meme generator, text-based prompts, and $AI tokens for purchasing credits. Moreover, the token is currently at the presale stage raising almost $12 million.
Read more:
- Fetch.ai Price Prediction as FET Surges Above 200DMA, Eyes $0.10
- Ripple Price Prediction: XRP/USD Recovery Above $0.23 Remains Consistent, Is $0.26 Achievable?
- Ethereum Price Prediction: Watch out for the Next Move as ETH/USD Bounces off $130 Support
Join Our Telegram channel to stay up to date on breaking news coverage


