Join Our Telegram channel to stay up to date on breaking news coverage
The Bitcoin price prediction shows that BTC is trading at $27,219 as the coin seems to be preparing for an upward movement.
Bitcoin Prediction Statistics Data:
- Bitcoin price now – $27,219
- Bitcoin market cap – $526.8 billion
- Bitcoin circulating supply – 19.3 million
- Bitcoin total supply – 19.3 million
- Bitcoin Coinmarketcap ranking – #1
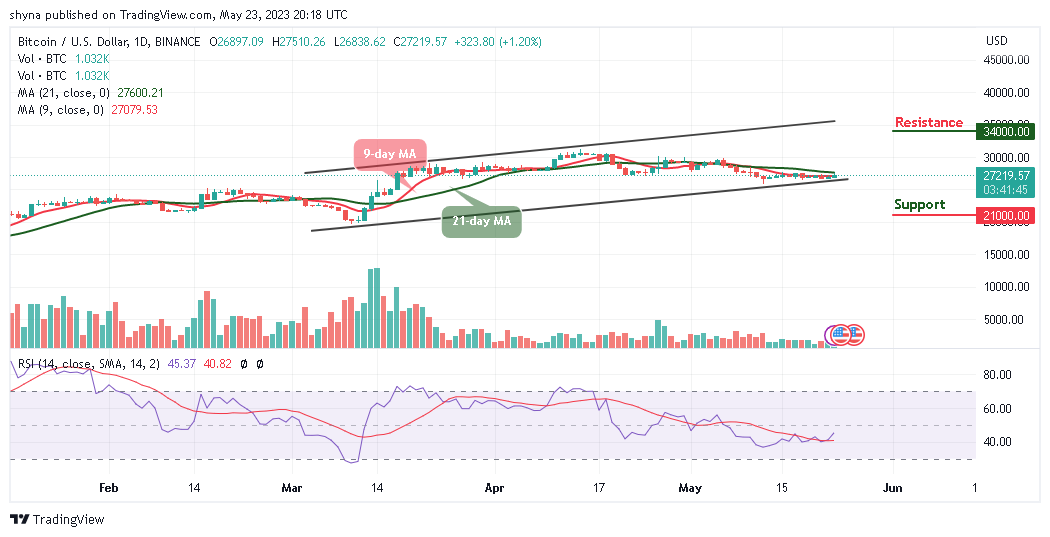
BTC/USD Long-term Trend: Ranging (Daily Chart)
Key levels:
Resistance Levels: $34,000, $36,000, $37,000
Support Levels: $21,000, $19,000, $17,000
BTC/USD is likely to cross above the 9-day and 21-day moving averages at $27,219 as the coin prepares to follow the upward movement. At the time of writing, the king coin is likely to extend toward the resistance level of $28,000 if the bulls put in more effort.
Bitcoin Price Prediction: Bitcoin (BTC) May Hit $28k Resistance
The Bitcoin price could begin to head toward the upside as the king coin moves to cross above the 9-day and 21-day moving averages, any further bullish movement above this barrier could locate the potential resistance levels at $34,000, $36,000, and $37,000. Nevertheless, if BTC/USD soars to the upper boundary of the channel, this could be a sign of sustainability and may likely result in a bullish continuation.
However, if the Bitcoin price fails to move up; traders could see a price cut below the lower boundary of the channel, and a further low could bring the price to the support levels at $21,000, $19,000, and $17,000 respectively. But as it stands, the Bitcoin price is likely to spike as the technical indicator Relative Strength Index (14) moves to cross above the 50-level.
BTC/USD Medium-term Trend: Ranging (4H Chart)
According to the 4-day chart, the Bitcoin price is hovering above the 9-day and 21-day moving averages. However, suppose the bulls push the market above this upper boundary of the channel, traders may expect a retest of the $28,000 resistance level, breaking this level may further push the price toward the resistance level of $28,500 and above as the technical indicator Relative Strength Index (14) remains above the 50-level, which is suggesting a sideways movement.
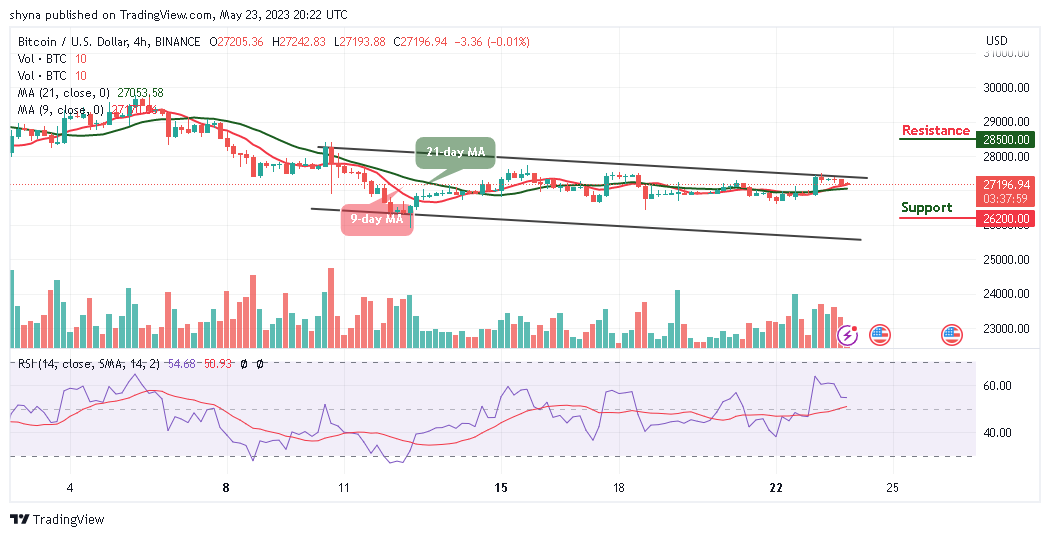
However, if the bulls failed to push the market above the channel, traders may expect a break below the moving averages, and breaking below this barrier may further bring the price toward the critical support level of $26,200 and below.
Alternatives to Bitcoin
The Bitcoin price is hovering below the 9-day and 21-day moving averages at $ 27,219 as the coin prepares to establish a bullish movement. At the time of writing, the first digital asset is likely to extend toward the resistance level of $28,000 if the bulls increase the buying pressure. Nevertheless, AiDoge is the latest blockchain project to capitalize on the rapid growth of artificial intelligence (AI). This new project has built a decentralized tool that enables users to instantly create unique memes from simple text prompts. Meanwhile, AIDoge is attracting attention for its unique AI meme generation utility and about $12 million has been raised in the presale.
Join Our Telegram channel to stay up to date on breaking news coverage