Join Our Telegram channel to stay up to date on breaking news coverage
The Bitcoin price prediction shows that BTC keeps following the sideways movement as the king coin fails to cross above the channel.
Bitcoin Prediction Statistics Data:
- Bitcoin price now – $27,610
- Bitcoin market cap – $531.5 billion
- Bitcoin circulating supply – 19.3 million
- Bitcoin total supply – 19.3 million
- Bitcoin Coinmarketcap ranking – #1
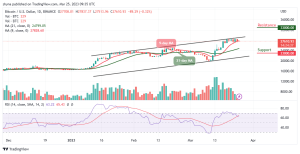
BTC/USD Long-term Trend: Ranging (Daily Chart)
Key levels:
Resistance Levels: $33,000, $35,000, $37,000
Support Levels: $23,000, $21,000, $19,000
BTC/USD is bound for a spike in volatility, but there seems to be no room for further losses after experiencing downward pressure. in the past few weeks. BTC/USD is hovering around $27,700 but the king coin has not been able to cross above the upper boundary of the channel.
Bitcoin Price Prediction: BTC Price May Consolidate Before the Next Action
According to the daily chart, the Bitcoin price might see further sideways price action as additional losses could play out until there is a change in the price movement. However, as the Bitcoin price ranges, the coin could rise and cross the upper boundary of the channel. On that note, the technical indicator Relative Strength Index (14) keeps moving above the 60-level, this could mean that the king coin may be ready for the upside.
From above, recovery could be set in bit by bit as the bulls may push the Bitcoin price above the resistance level of $28,000, and a sustainable movement above the channel could allow for an extended recovery in the direction of the potential resistance levels at $33,000, $35,000, and $37,000. On the downside, any bearish movement below the 9-day and 21-day moving averages may cause the Bitcoin price to hit the supports at $23,000, $21,000, and $19,000.
BTC/USD Medium-term Trend: Ranging (4H Chart)
Looking at the 4-hour chart, the Bitcoin price is hovering below the 9-day and 21-day moving averages. BTC/USD may cross above the moving averages as the market recovers from the bearish momentum. However, if the price is stable above the moving averages, it could locate the resistance level of $32,000 and above.
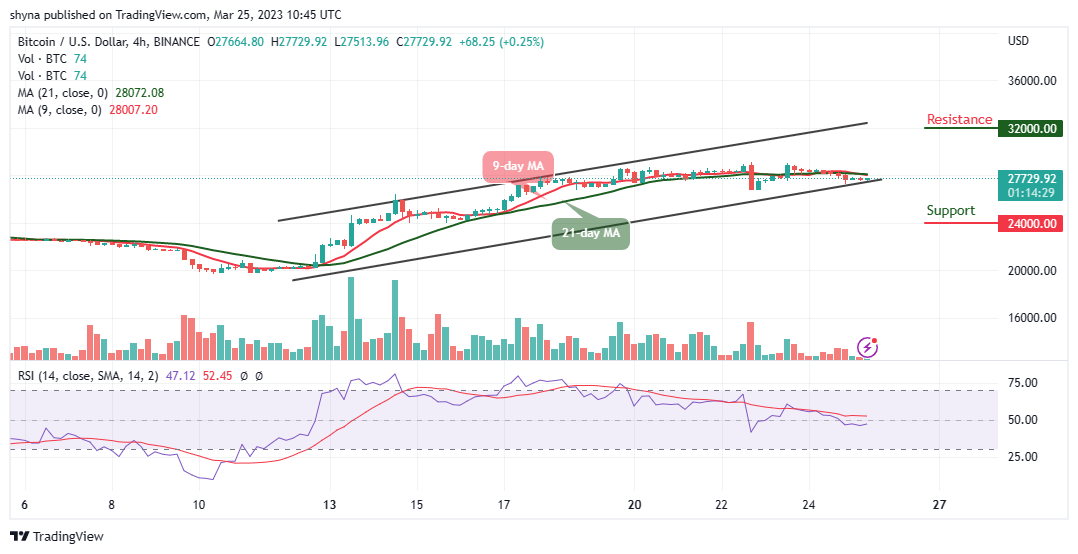
Moreover, if the bearish movement steps back, the Bitcoin price is likely to cross below the lower boundary of the channel and could touch the support level of $24,000 and below. Nevertheless, the technical indicator Relative Strength Index (14) is likely to slide and face the 40-level to confirm the bearish movement.
Alternatives to Bitcoin
The Bitcoin price indicates bearish momentum as further upside was rejected overnight and bullish momentum has been lost. On the upside, recovery may not come easy as the support will have to be sort for above the upper boundary of the channel. However, Love Hate Inu ensures you have the chance to voice your opinion and find a supportive community. At the moment, LHINU tokens are still in presale, almost $2m has been raised as time is running out because the price will increase in the next few days, so grab it now.
Join Our Telegram channel to stay up to date on breaking news coverage