Join Our Telegram channel to stay up to date on breaking news coverage
The Bitcoin price prediction is falling again in a narrow channel after consolidating, but buying interest could pick up if the price approaches $27,000.
Bitcoin Prediction Statistics Data:
- Bitcoin price now – $27,954
- Bitcoin market cap – $536.8 billion
- Bitcoin circulating supply – 19.3 million
- Bitcoin total supply – 19.3 million
- Bitcoin coinmarketcap ranking – #1
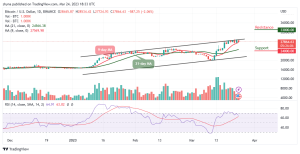
BTC/USD Long-term Trend: Bullish (Daily Chart)
Key levels:
Resistance Levels: $33,000, $35,000, $37,000
Support Levels: $24,000, $22,000, $20,000
During the European session today, BTC/USD begins the day with a resistance level of $28,534 and it is now dropping toward the 9-day moving average at the time of writing. However, the psychological barrier of $28,500 still serves as the first important resistance within the market and a sustainable move above the upper boundary of the channel may likely push the price toward the resistance level of $29,000.
Bitcoin Price Prediction: Will Bitcoin (BTC) Drop More?
On the intraday chart, the Bitcoin price is likely to break below the 9-day moving average, which may increase the selling pressure. At the time of writing, BTC/USD is hovering at $27,864 and if this is cleared, the dips to $27,000 are likely to be bought, which means the overall bullish sentiments may prevail.
Moreover, if the price moves below the mentioned support, $25,000 could come into focus which served as support during the previous consolidation period while the critical supports lie at $24,000, $22,000, and $20,000. Looking at the upside, the first resistance may likely come at $28,500 if the king coin rebounded. Once this is done, $29,000 could come back into focus. Further bullish movement may hit the potential resistance levels at $33,000, $34,000, and $36,000 as the Relative Strength Index (14) moves below 70 levels.
BTC/USD Medium-term Trend: Ranging (4H Chart)
The 4-hour chart shows that the Bitcoin bears are still in play within the market keeping the Bitcoin price below the 9-day and 21-day moving averages. Although BTC/USD has not yet slipped below $27,500, it’s still in the loop of making a bounce back.
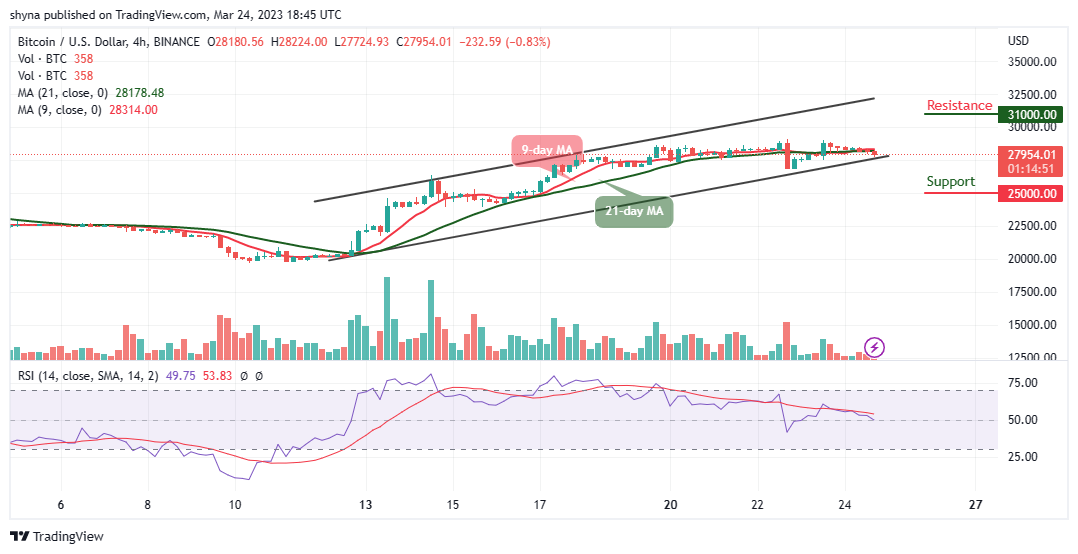
Moreover, the Bitcoin price is currently hovering below the moving averages at the time of writing. The upward movement could push the price to the resistance of $31,000 and above while the immediate support lies at $25,000 and below. The Relative Strength Index (14) is moving to cross below the 50-level, which indicates bearish movement.
Alternatives to Bitcoin
The Bitcoin (BTC) faces rejection thrice at the $28,000 resistance zone as Bitcoin could revisit $27,000, this signals the resumption of selling pressure. Meanwhile, from every indication, the downtrend is likely to extend to the low of $26,000. Notwithstanding the current movement of the king coin, there is another token which is selling so hot in the market. Love Hate Inu (LHINU) is making waves in the market by introducing a novel concept that has never been explored before. At the time of writing, LHINU tokens are in presale, and almost $2m has been raised so far.
Join Our Telegram channel to stay up to date on breaking news coverage