Join Our Telegram channel to stay up to date on breaking news coverage
The Bitcoin price prediction sees a 4.45% decline over the past few hours as the cryptocurrency fails at $29,104 and heads lower.
Bitcoin Prediction Statistics Data:
- Bitcoin price now – $27,096
- Bitcoin market cap – $521.4 billion
- Bitcoin circulating supply – 19.3 million
- Bitcoin total supply – 19.3 million
- Bitcoin Coinmarketcap ranking – #1
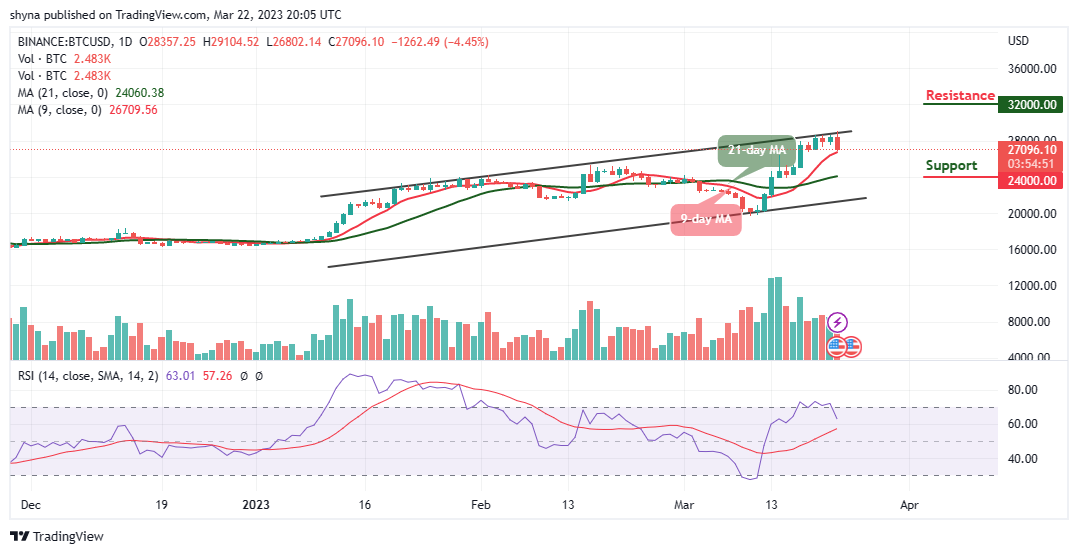
BTC/USD Long-term Trend: Bullish (Daily Chart)
Key levels:
Resistance Levels: $32,000, $34,000, $36,000
Support Levels: $24,000, $22,000, $20,000
BTC/USD loses its momentum after touching key resistance above $29,104. As of writing, the king coin is down 4.45% on the day at $26,802 facing the 9-day and 21-day moving averages. Meanwhile, Bitcoin may struggle to close above $28,000, and if it does, it should be free to rise well above $29,000 if it moves toward the upper boundary of the channel.
Bitcoin Price Prediction: Can Bitcoin Price Trade Above $29k?
After a slightly positive move above $29,000, the Bitcoin price could slide below the 9-day and 21-day moving averages. Over the past few days, the king coin has been struggling to cross above the upper boundary of the channel. In today’s session, the Bitcoin price attempted to push higher, but the sellers stepped into the market to bring the market price lower to touch the daily low of $26,802.
Nevertheless, if the coin moves lower, the $26,000 may serve as the nearest support level, which may likely make room for the coin to fall further to hit the supports at $24,000, $22,000, and $20,000. The Relative Strength Index (14) is likely to cross below the 60- level, which could follow the downward movement. On the contrary, BTC/USD may likely cross above the upper boundary of the channel to hit the resistance levels of $32,000, $34,000, and $36,000.
BTC/USD Medium-term Trend: Ranging (4H Chart)
On the 4-Hour chart, the BTC price hovers around $27,202 and may likely cross above the 9-day and 21-day moving averages. However, if the bulls gather enough strength, the upward movement may be near the resistance level of $31,000 and above.
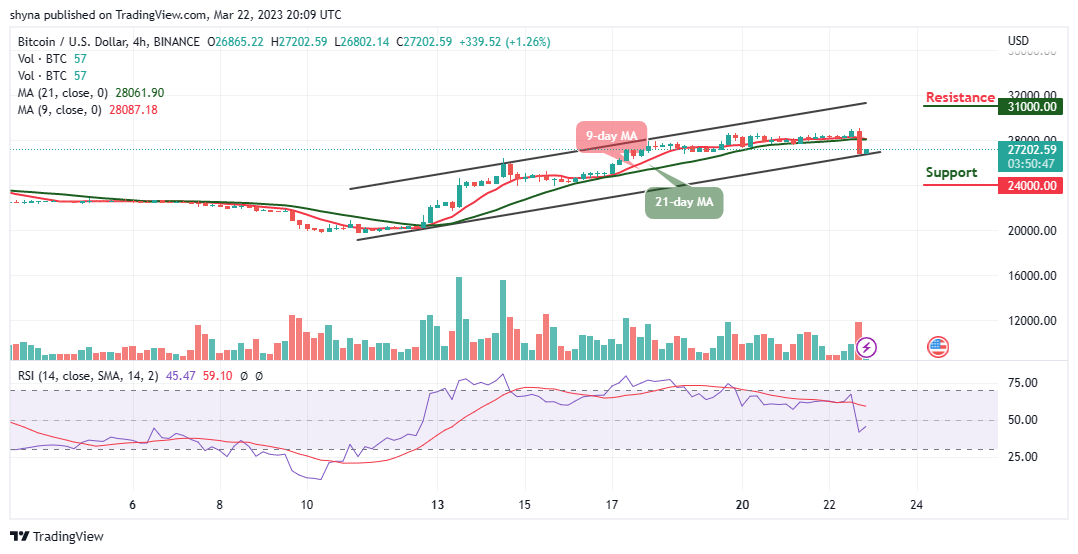
On the downside, if the king coin head to the south, the immediate support could be located around the $26,000 level while critical support is at $24,000 and below. Therefore, the Bitcoin price may likely cross below the lower boundary of the channel if the bears put more pressure on the market, Moreover, the Relative Strength Index (14) is seen below the 50-level, indicating that buyers may come to play.
Alternatives to Bitcoin
According to the daily chart, it is important for the Bitcoin price to hold above the 9-day moving average within the channel and confirm it otherwise there can come a bearish breakdown when BTC/USD falls below this barrier. However, Love Hate Inu has been gaining popularity online which is evident from the success of its presale as many investors are rushing to secure the token. At the moment, investors can buy LHINU through the ongoing presale as almost $2 million has been raised.
Join Our Telegram channel to stay up to date on breaking news coverage