
Join Our Telegram channel to stay up to date on breaking news coverage
The Bitcoin price prediction shows that BTC rises in the early hours of today but got rejected as the market ranges.
Bitcoin Prediction Statistics Data:
- Bitcoin price now – $28,239
- Bitcoin market cap – $543.8 billion
- Bitcoin circulating supply – 19.3 million
- Bitcoin total supply – 19.3 million
- Bitcoin Coinmarketcap ranking – #1
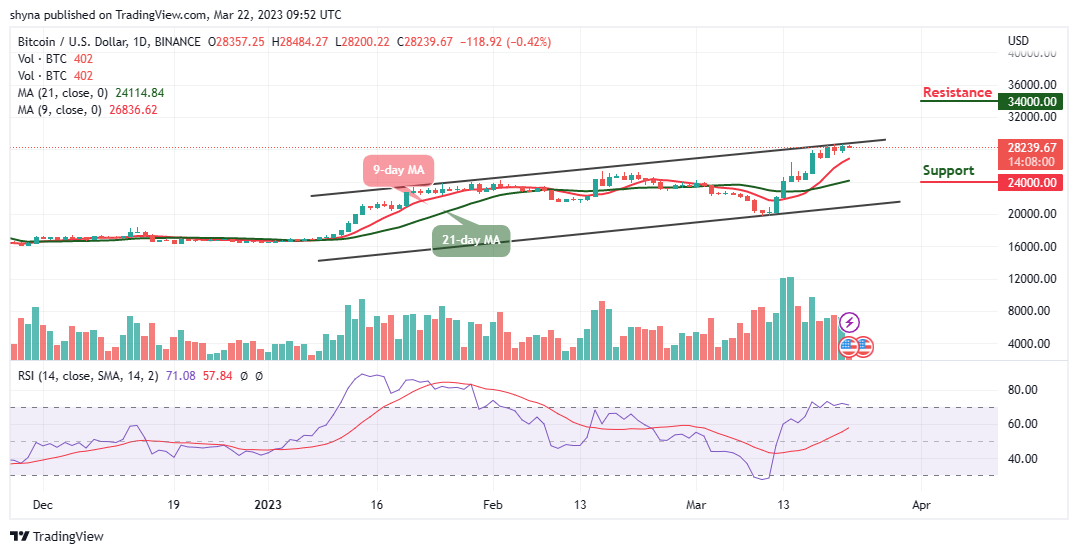
BTC/USD Long-term Trend: Bullish (Daily Chart)
Key levels:
Resistance Levels: $34,000, $36,000, $38,000
Support Levels: $24,000, $22,000, $20,000
BTC/USD may begin to follow the bearish movement if the bears force the king coin to bow down to fresh losses. At the time of writing, the Bitcoin (BTC) is changing hands at $28,239 after adjusting from the resistance level of $28,484 which is an intraday high. Moreover, the Bitcoin price may be vulnerable to losses if the price crosses below the 9-day moving average.
Bitcoin Price Prediction: Bitcoin (BTC) Bears May Show Again
The Bitcoin price from a technical angle reveals that the market price may follow the downtrend or continue to move sideways because the bullish movement is not that visible now. However, the technical indicator Relative Strength Index (14) may confirm the bearish movement if the signal line drops below the 70-level.
Moreover, bulls are currently banking on the 9-day moving average to ensure that despite a reversal, the Bitcoin price stays above this barrier. Any bearish movement below this could draw the coin towards the lower boundary of the channel and may cause the coin to reach the critical supports at $24,000, $22,000, and $20,000. Following the upward movement, if the coin crosses above the upper boundary of the channel, it may hit the potential resistance levels at $34,000, $36,000, and $38,000 respectively.
BTC/USD Medium-term Trend: Ranging (4H Chart)
As the 4-hour chart reveals, the Bitcoin price is seen moving in the same direction above the 9-day and 21-day moving averages, and the bears are likely to come back into the market while the bulls are trying to defend the $28,200 support. If not, the support levels of $25,000 and below may come into play should the coin focuses on the downward movement.
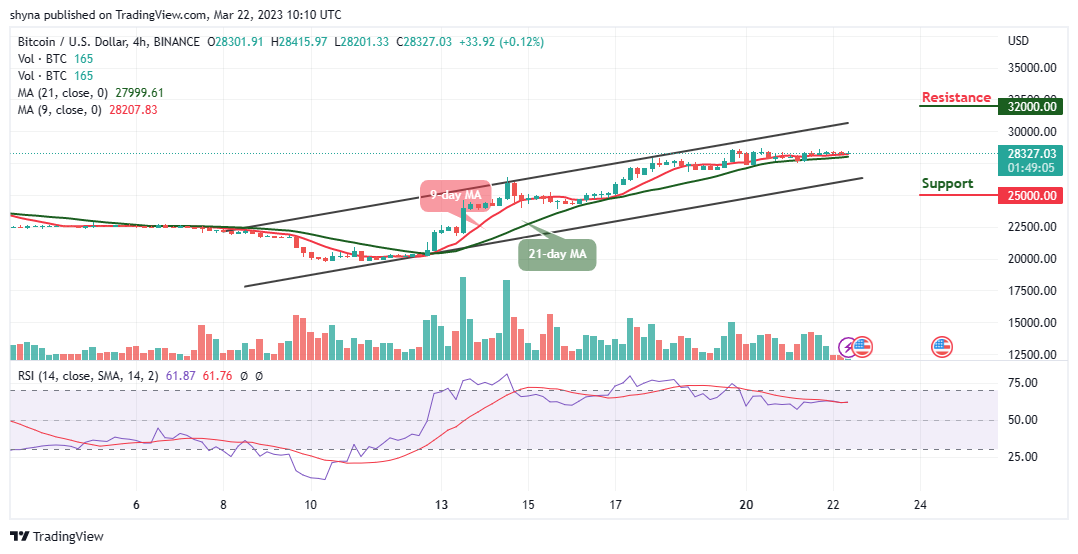
Moreover, buyers may need to regroup and hold the support of $28,200, once this is done, traders may expect a movement towards the upper boundary of the channel, and this could push the king coin to the resistance levels of $32,000 and above. Meanwhile, the technical indicator Relative Strength Index (14) is seen moving in the same direction above the 60-level, suggesting sideways movement.
Alternatives to Bitcoin
As of the time of this writing, the Bitcoin price still sits above $28,000 as a near $28,500 peak was seen with this recent rally during the European session today but currently correcting downwards as the market prepares for another trading day. On that note, if you are interested in investing in a cryptocurrency that offers real value along with strong community backing – Love Hate Inu (LHINU) is a new vote-to-earn cryptocurrency platform that allows members to earn token rewards for voting on different matters and hosting new polls. The token has raised almost $2 million in the ongoing presale.
Join Our Telegram channel to stay up to date on breaking news coverage