Join Our Telegram channel to stay up to date on breaking news coverage
The Bitcoin price prediction shows that BTC rises in the early hours of today, but got rejected as the market ranges.
Bitcoin Prediction Statistics Data:
- Bitcoin price now – $24,399
- Bitcoin market cap – $482.6 billion
- Bitcoin circulating supply – 19.3 million
- Bitcoin total supply – 19.3 million
- Bitcoin Coinmarketcap ranking – #1
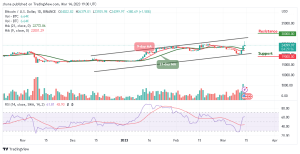
BTC/USD Long-term Trend: Ranging (Daily Chart)
Key levels:
Resistance Levels: $30,000, $32,000, $34,000
Support Levels: $19,000, $17,000, $15,000
At the time of writing, BTC/USD is changing hands at $24,399 after adjusting from the resistance level of $26,379 which is an intraday high. Moreover, the Bitcoin price may be vulnerable to losses if the price crosses below the 9-day and 21-day moving averages.
Bitcoin Price Prediction: Bitcoin (BTC) Bears May Show Again
The Bitcoin price from a technical angle reveals that the market price may follow the downtrend or move sideways because the bullish movement may not be visible now. Meanwhile, the technical indicator Relative Strength Index (14) may confirm the bearish movement if the signal line drops below the 60-level.
Moreover, bulls are currently banking on the 21-day moving average to ensure that despite a reversal, the Bitcoin price stays above this barrier. Any bearish movement below this could draw the coin towards the lower boundary of the channel and may cause the coin to reach the critical supports at $19,000, $17,000, and $15,000. Following the upward movement, if the coin crosses above the upper boundary of the channel, it may hit the nearest resistance levels at $30,000, $32,000, and $34,000 respectively.
BTC/USD Medium-term Trend: Ranging (4H Chart)
As the 4-hour chart reveals, the Bitcoin price is seen retreating toward the 9-day and 21-day moving averages, and the bears are likely to come back into the market while the bulls are trying to defend the $24,000 support. If not, the support level of $22,000, and below may come into play if the coin focuses on the downward movement.
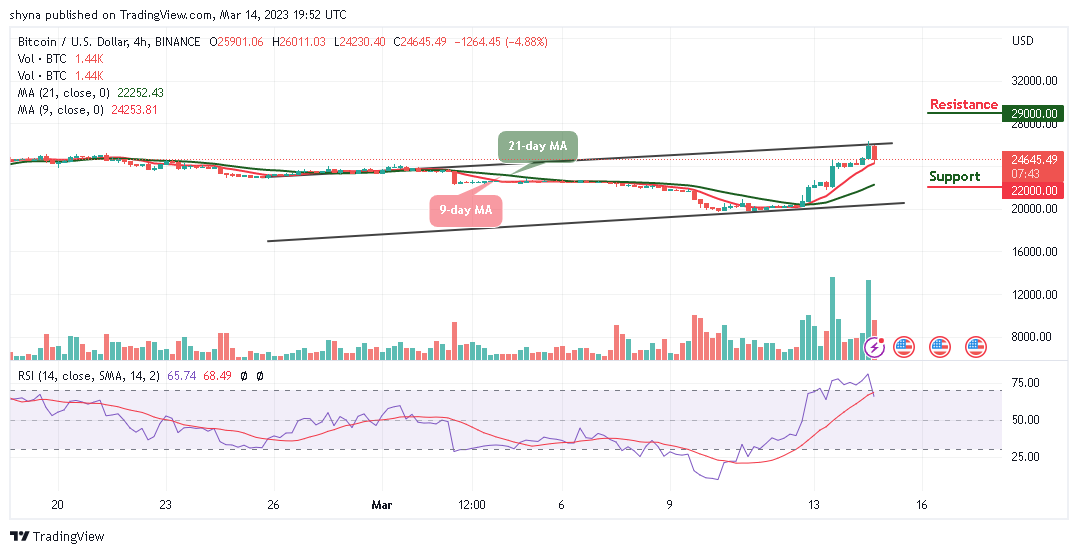
Moreover, buyers may need to regroup and hold the support of $24,230, once this is done, traders may expect a movement above the upper boundary of the channel, and this could push the king coin to the resistance level of $29,000 and above. Meanwhile, the technical indicator Relative Strength Index (14) is seen dropping below the 70-level, suggesting a bearish movement.
Alternatives to Bitcoin
There could be more losses for Bitcoin (BTC) if it fails to trade above the resistance level of $26,500, it could struggle to stay in a positive zone but the immediate support on the downside could be found around the $22,000 level. Nevertheless, the FGHT token has proved to be one of the most outstanding cryptos in the market after effectively targeting the gaps in the industry to provide a customer-driven approach to the investors as close to $6m has been raised in the ongoing presale.
Join Our Telegram channel to stay up to date on breaking news coverage