Join Our Telegram channel to stay up to date on breaking news coverage
The Bitcoin price prediction is showing positive signs as the king coin heads to the upside, suggesting further higher levels.
Bitcoin Prediction Statistics Data:
- Bitcoin price now – $24,299
- Bitcoin market cap – $470.8 billion
- Bitcoin circulating supply – 19.3 million
- Bitcoin total supply – 19.3 million
- Bitcoin Coinmarketcap ranking – #1
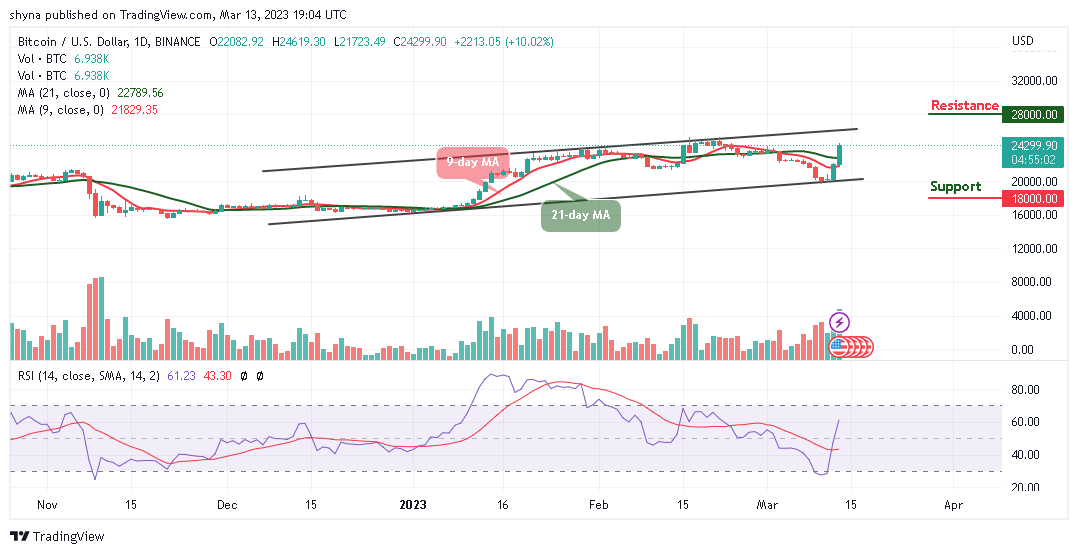
BTC/USD Long-term Trend: Ranging (Daily Chart)
Key levels:
Resistance Levels: $28,000, $30,000, $32,000
Support Levels: $18,000, $16,000, $14,000
BTC/USD climbs above the resistance level of $24,000 as the Bitcoin price sets its eye on $25,000 and the king coin will continue to enjoy a sharp uptrend as long the crypto can keep this trend up. Meanwhile, the Bitcoin price is within touching distance of forming another high above the previous high of $26,000, which is quite remarkable.
Bitcoin Price Prediction: Where is Bitcoin Price Going Next?
The Bitcoin price is trading comfortably towards the upper boundary of the channel as the price establishes a new bullish signal. At the moment, traders could say that the long-term outlook favors the bulls, giving the daily close produced a large bullish engulfing candle with eyes now set on the daily resistances at $28,000, $30,000, and $32,000 respectively.
On the contrary, any drop from the current level could lead to declines in the critical support below the 9-day and 21-day moving averages. However, in case BTC drops and revisits the low of $21,723 support, then the coin can rely on the long-term support levels at $18,000, $16,000, and $14,000. Moreover, the technical indicator Relative Strength Index (14) is now moving above the 60-level, suggesting more bullish signals.
BTC/USD Medium-term Trend: Ranging (4H Chart)
According to the 4-hour chart, the Bitcoin price is seen trading above the 9-day and 21-day moving averages at $24,310. However, today’s price move happens to be an impressive one as it climbs above the long-awaited resistance level of $24,000 with a sharp upsurge. On that note, BTC/USD is now maintaining its bull run as the technical indicator Relative Strength Index (14) moves within the overbought region.
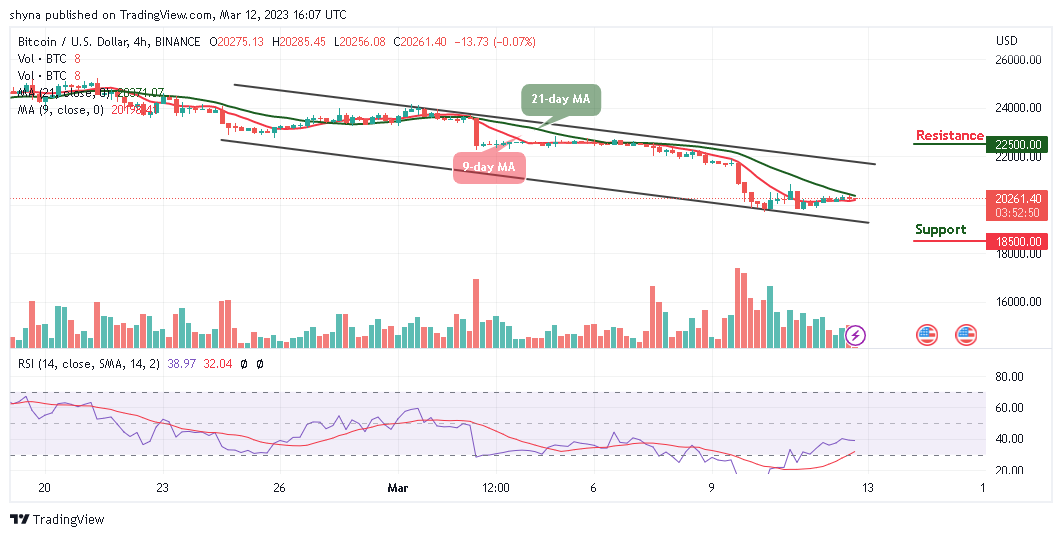
In other words, BTC may take a downward move if the bulls failed to push the price higher, and the coin may breach below the 9-day and 21-day moving averages, which could hit the support at $20,000 and below. Nevertheless, if the bulls find a decent resistance level of above $25,000, the king coin may cross above the channel which could hit the resistance level of $28,000 and above.
Alternatives to Bitcoin
The Bitcoin price is seen trading positively within the channel. As the king coin prepares to cross above the upper boundary of the channel, any further increase could increase the current market value to reach the potential resistance at $25,000. Meanwhile, the FGHT token is still doing great in the ongoing presale. It has proved to be one of the most promising cryptocurrencies after effectively targeting the gaps in the move-to-earn industry to provide a customer-driven approach and close to $6 million has been raised so far.
Join Our Telegram channel to stay up to date on breaking news coverage