Join Our Telegram channel to stay up to date on breaking news coverage
As the Bitcoin price prediction shoots above $19,500, the bulls are ready to push the king coin to cross the resistance level of $20,000.
Bitcoin Prediction Statistics Data:
- Bitcoin price now – $19,871
- Bitcoin market cap – $379.7 billion
- Bitcoin circulating supply – 19.0 million
- Bitcoin total supply – 19.0 million
- Bitcoin Coinmarketcap ranking – #1
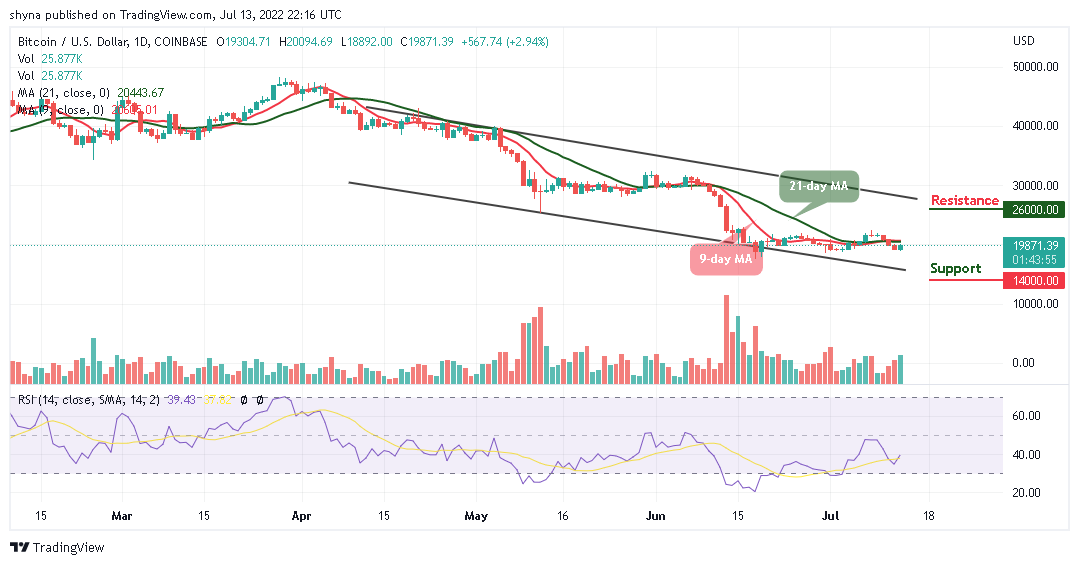
BTC/USD Long-term Trend: Bearish (Daily Chart)
Key levels:
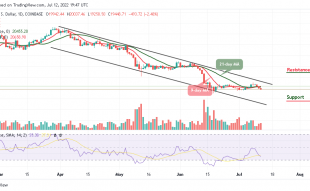
Resistance Levels: $26,000, $28,000, $30,000
Support Levels: $14,000, $12,000, $10,000
BTC/USD is following a bullish movement at the time of writing as the king coin may begin an increase above the 9-day and 21-day moving averages. At the beginning of today’s trading, the Bitcoin price touches the $20,000 resistance level. At the time of writing, BTC/USD is likely to settle above the 9-day and 21-day moving averages to increase the bullish movement.
Bitcoin Price Prediction: BTC Price Heads to the Upside
The Bitcoin price is seen trading positively, as the king coin prepares to cross above the 9-day and 21-day moving averages. However, any further increase in the bullish movement could increase the current market value to reach the potential resistance at $22,000. The buyers may then locate the resistance levels at $26,000, $28,000, and $30,000 if the bulls put more effort.
In the meantime, if the resistance level of $20,000 fails to hold, it may reverse and face the support level of $19,000, further increase in the bears’ pressure may bring down the price below the lower boundary of the channel, and this could cause the king coin to hit the support levels at $14,000, $12,000, and $10,000 respectively. Moreover, the technical indicator Relative Strength Index (14) may cross above 40-level to increase the bullish movement.
BTC/USD Medium-Term Trend: Ranging (4H Chart)
On the 4-hour chart, the Bitcoin price is hovering within the 9-day and 21-day moving averages at a price value of $19,916. With the look of things, the bulls may push the price towards the upper boundary of the channel but any bearish cross below the 9-day moving average may bring the coin towards the support level of $18,500 and below.
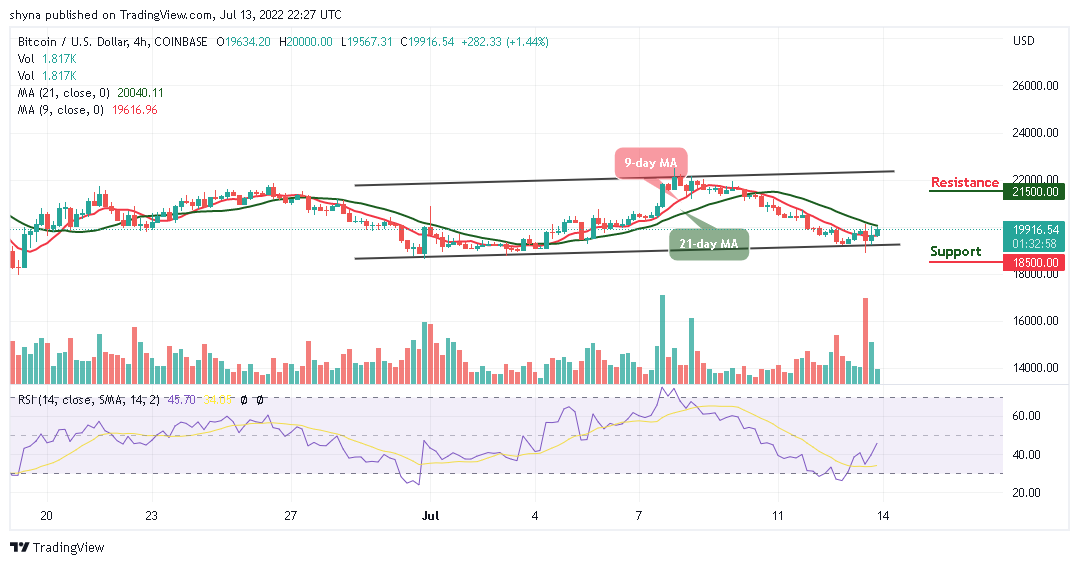
Moreover, if the Bitcoin price finds a decent resistance level at $20,000 level, the first digital asset may cross above the 21-day moving average to hit the resistance level of $21,500 and above. Now, the technical indicator Relative Strength Index (14) is moving to cross above the 50-level, suggesting additional bullish signals in the market.
Read more:
- How to buy Bitcoin
- How to buy Cryptocurrency
Join Our Telegram channel to stay up to date on breaking news coverage