Join Our Telegram channel to stay up to date on breaking news coverage
The Bitcoin price prediction shows that BTC is trading at $16,837 as the coin seems to be preparing for another upward movement.
Bitcoin Prediction Statistics Data:
- Bitcoin price now – $16,837
- Bitcoin market cap – $324.3 billion
- Bitcoin circulating supply – 19.2 million
- Bitcoin total supply – 19.2 million
- Bitcoin Coinmarketcap ranking – #1
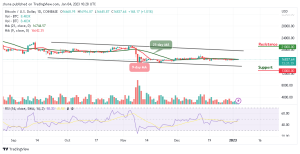
BTC/USD Long-term Trend: Ranging (Daily Chart)
Key levels:
Resistance Levels: $21,000, $23,000, $25,000
Support Levels: $13,000, $11,000, $9,000
BTC/USD is attempting a fresh increase above the 9-day and 21-day moving averages as the king coin trades at $16,837. At the time of writing, the Bitcoin price could gain bullish momentum if there is a clear move above the $17,000 resistance. However, the first digital asset could rise further if there is a strong bullish movement toward the upper boundary of the channel.
Bitcoin Price Prediction: BTC/USD Ready for A Cross Above $171k
The Bitcoin price is crossing above the 9-day and 21-day moving averages, any further bullish movement could locate the potential resistance levels at $21,000, $23,000, and $25,000. Normally, when new uptrends are coming up, traders may use the moving averages to gauge the strength of the trend. Nevertheless, if BTC/USD soars above the upper boundary of the channel, it could be a sign of sustainability and could result in a bullish continuation.
Additionally, if the Bitcoin price fails to move up; traders may see a price cut towards the lower boundary of the channel, and a further low could bring the price to the support levels at $13,000, $11,000, and $9,000 respectively. But as it stands, the Bitcoin price is likely to rise as the technical indicator Relative Strength Index (14) moves to cross above the 50-level.
BTC/USD Medium-term Trend: Ranging (4H Chart)
According to the 4-hour chart, the market is following a sideways movement above the 9-day and 21-day moving averages as the bulls are coming back into the market to push the king coin above the upper boundary of the channel. If not, the support level of $16,600 and below may come into play.
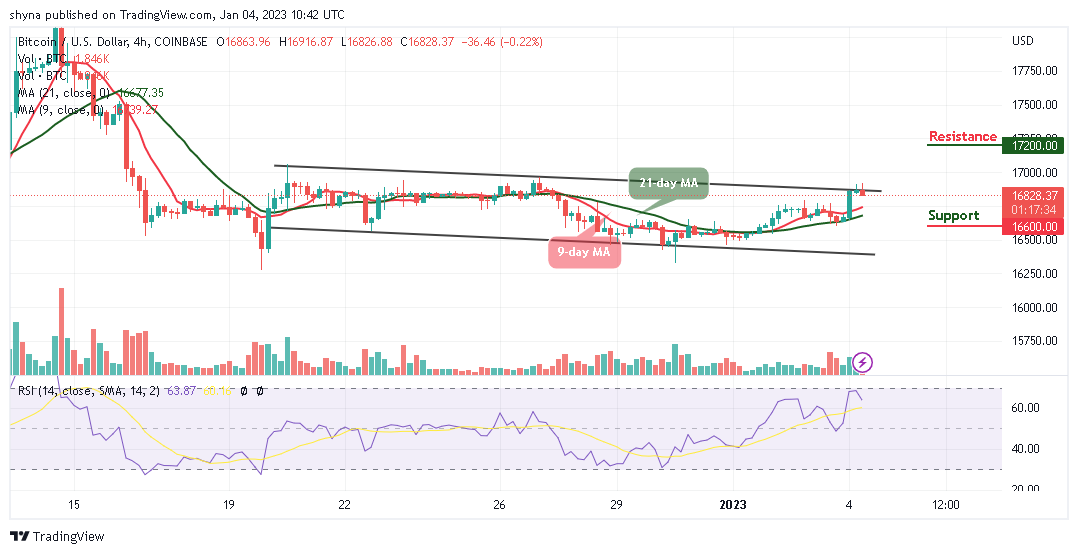
However, if the bulls push the market above the channel, traders may expect a retest of the $17,000 resistance level, and breaking this level could hit the resistance level of $17,200 and above. Meanwhile, the technical indicator Relative Strength Index (14) nosedives below the 70-level, suggesting a bearish signal.
Meanwhile, Dash 2 Trade gives you the ability to optimize your trading and speculative profitability with effective crypto trading recommendations, auto trading, and analytics features. There is a D2T token presale ongoing and time is running out. The presale dashboard launch is coming soon since the product dev is ahead of the schedule and about $14 million has been raised so far.
Related
- D2T Price Prediction
- How to Buy D2T
Join Our Telegram channel to stay up to date on breaking news coverage