Join Our Telegram channel to stay up to date on breaking news coverage
The Bitcoin price prediction shows that BTC keeps following the sideways movement as the king coin fails to cross above the channel.
Bitcoin Prediction Statistics Data:
- Bitcoin price now – $16,733
- Bitcoin market cap – $322.4 billion
- Bitcoin circulating supply – 19.2 million
- Bitcoin total supply – 19.2 million
- Bitcoin Coinmarketcap ranking – #1
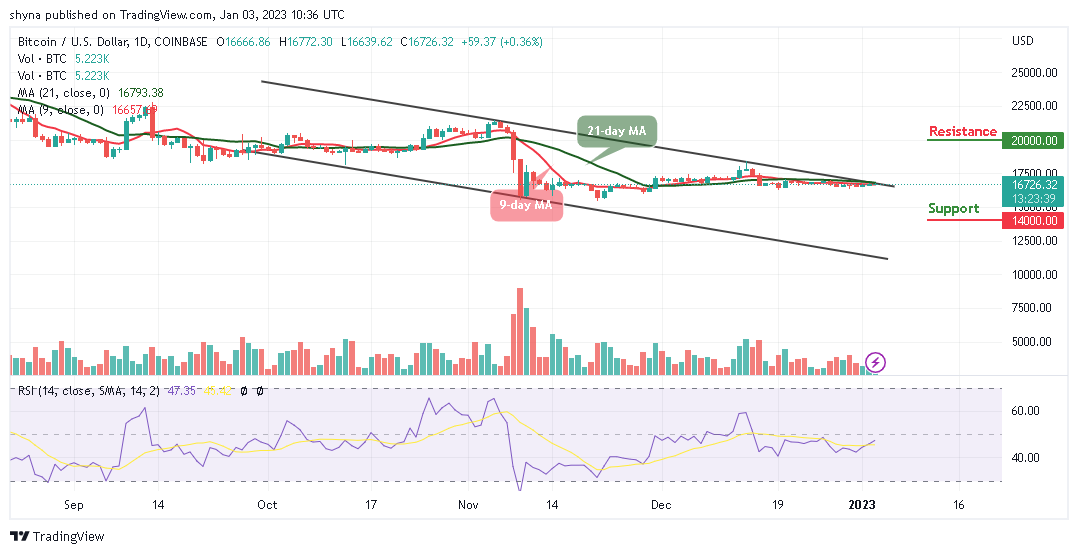
BTC/USD Long-term Trend: Ranging (Daily Chart)
Key levels:
Resistance Levels: $20,000, $22,000, $20,000
Support Levels: $14,000, $12,000, $10,000
In its first two days of 2023, BTC/USD is bound for a spike in volatility, but there seems to be no room for further losses after experiencing downward pressure. in the past few weeks. The Bitcoin price is hovering at $16,729 but the king coin has not been able to cross above the 9-day and 21-day moving averages.
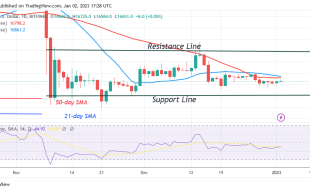
Bitcoin Price Prediction: BTC Price May Consolidate Before the Next Action
According to the daily chart, the Bitcoin price might see further sideways price action as additional losses could play out until there is a change in the price movement. However, as the Bitcoin price ranges, the coin could rise and cross the upper boundary of the channel. On that note, the technical indicator Relative Strength Index (14) moves to cross above the 50-level, this could mean that the king coin may be ready for the upside.
From above, recovery could be set in bit by bit as the bulls may push the Bitcoin price above the resistance level of $17,000, and a sustainable movement above the channel could allow for an extended recovery in the direction of the potential resistance levels at $20,000, $22,000, and $24,000. On the downside, any bearish movement below the 9-day and 21-day moving averages may cause the Bitcoin price to hit the supports at $14,000, $12,000, and $10,000.
BTC/USD Medium-term Trend: Ranging (4H Chart)
Looking at the 4-hour chart, the Bitcoin price is hovering above the 9-day and 21-day moving averages. BTC/USD may cross above the upper boundary of the channel as the market recovers from the bearish momentum. However, if the price is stable above the channel, it could locate the resistance level of $17,000 and above.
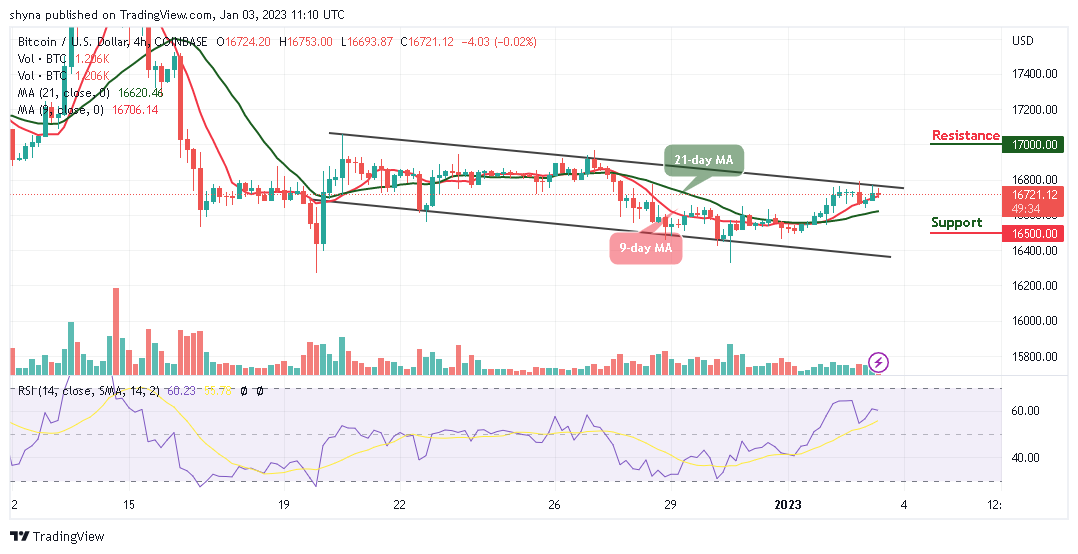
Moreover, if the bearish movement steps back, the Bitcoin price is likely to. Cross below the moving averages and could touch the support level of $16,500 and below. Nevertheless, the technical indicator Relative Strength Index (14) is likely to slide below the 60-level to confirm the bearish movement.
Meanwhile, Dash 2 Trade gives you the ability to optimize your trading and speculative profitability with effective crypto trading recommendations, auto trading, and analytics features. There is a D2T token presale ongoing and time is running out. The presale dashboard launch is coming soon since the product dev is ahead of the schedule. Therefore, almost $12.5 million has been raised so far.
Related
- D2T Price Prediction
- How to Buy D2T
Join Our Telegram channel to stay up to date on breaking news coverage