Join Our Telegram channel to stay up to date on breaking news coverage
The Bitcoin price prediction gains 3.06% as bulls keep working hard to nurture a bullish trend from the support at $22,974.
Bitcoin Prediction Statistics Data:
- Bitcoin price now – $23,734
- Bitcoin market cap – $460.6 billion
- Bitcoin circulating supply – 19.2 million
- Bitcoin total supply – 19.2 million
- Bitcoin Coinmarketcap ranking – #1
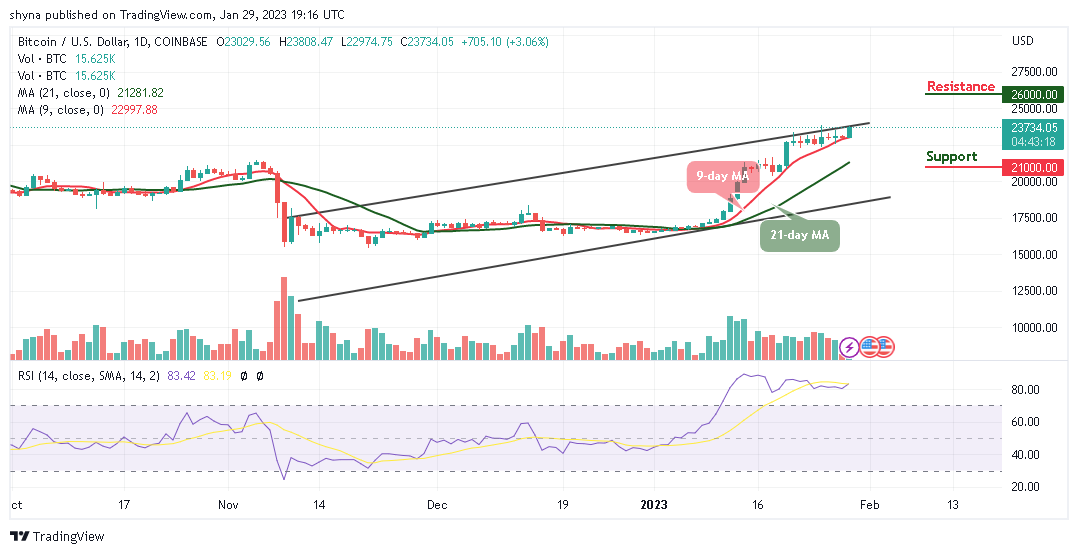
BTC/USD Long-term Trend: Bullish (Daily Chart)
Key levels:
Resistance Levels: $26,000, $28,000, $30,000
Support Levels: $21,000, $19,000, $17,000
BTC/USD is currently trading at the $23,734 resistance level as the market price is hovering above the 9-day and 21-day moving averages, indicating a bullish movement since the beginning of today. For the past few days, the Bitcoin price has been moving sideways and in the context of the Bitcoin exchange rate forecast; an application of $24,000 resistance is expected.
Bitcoin Price Prediction: Will BTC Break Above $24,000 Resistance Level?
According to the daily chart, if the Bitcoin price can cross above the upper boundary of the channel, it is likely for the market price to touch the $24,000 level. This is where traders should expect buyers to fight for a further rise in BTC/USD and further development of the bullish trend. Looking at the market movement, there is likely that the Bitcoin price may experience a quick retracement or sell-off just in case it touches the crucial $22,000 level, but if not; traders may see additional resistance levels of $27,000, $29,000, and $31,000 respectively.
On the downside, if the market decides to fall, BTC/USD could slide toward the lower boundary of the channel, and the Bitcoin price could hit the support levels of $21,000, $19,000, and $17,000. As revealed by the technical indicator, the market may gain more if the Relative Strength Index (14) remains within the overbought region.
BTC/USD Medium-term Trend: Bullish (4H Chart)
On the 4-hour chart, traders expect the coin to keep the upward movement, it could hit the nearest resistance level of $24,000. On the contrary, if the selling pressure exists, it could hold the coin not to follow the upward movement, and the $22,000 and below may come into play.
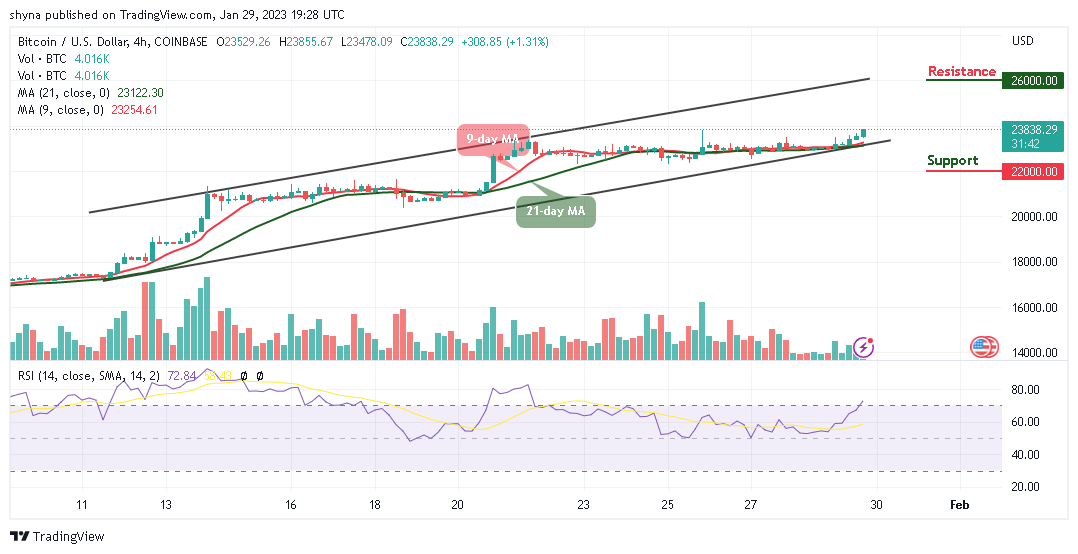
However, in as much as the buyers keep the price above the moving averages, traders may expect a strong bullish movement that could hit the resistance at $26,000 and above. Meanwhile, the technical indicator Relative Strength Index (14) is crossing into the overbought region, suggesting that more bullish signals may play out.
Bitcoin Alternatives
The Bitcoin price is trading well at the moment as the king coin could hit the resistance level of $24k in the next positive direction. Meanwhile, due to its high rates of return on investment, the Meta Masters Guild (MEMAG) token benefits traders. This token is this year’s Play-to-Earn guild with the fastest growth. As a result, it will be Web3’s largest mobile gaming guild. It is possible to develop games that are entertaining and intriguing and work with NFTs. And there, community members receive rewards for their investments and speculation. There has already been close to $2 million raised during the MEMAG presale.
Join Our Telegram channel to stay up to date on breaking news coverage