
Join Our Telegram channel to stay up to date on breaking news coverage
The Bitcoin price prediction is trading below $23,000 but it could gain bullish momentum if there is a clear move to the upside.
Bitcoin Prediction Statistics Data:
- Bitcoin price now – $22,856
- Bitcoin market cap – $441.3 billion
- Bitcoin circulating supply – 19.2 million
- Bitcoin total supply – 19.2 million
- Bitcoin Coinmarketcap ranking – #1
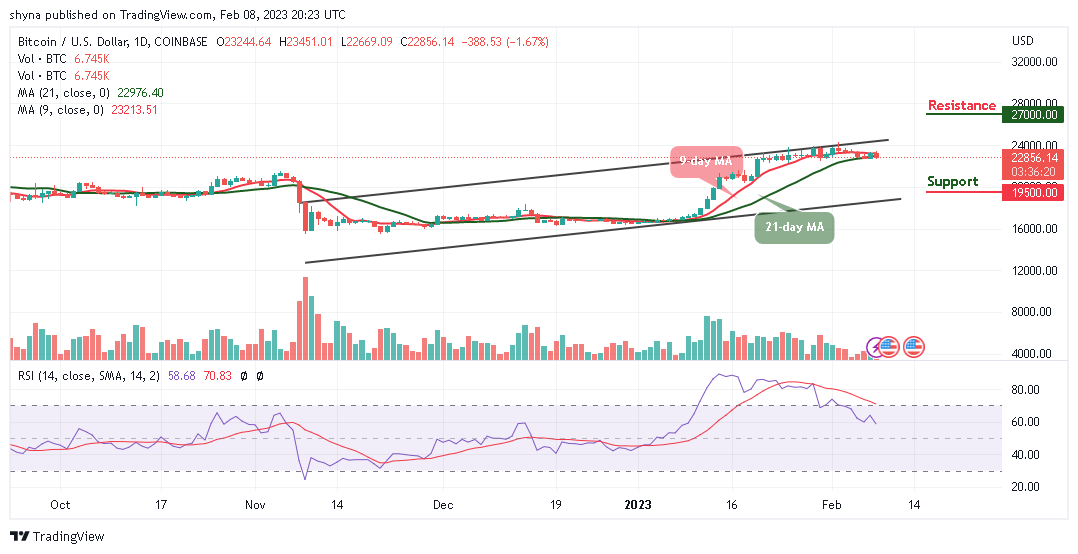
BTC/USD Long-term Trend: Ranging (Daily Chart)
Key levels:
Resistance Levels: $27,000, $28,000, $29,000
Support Levels: $19,500, $18,500, $17,500
The daily chart reveals that BTC/USD could not reclaim the previous resistance level of $23,500 as the Bitcoin price keeps ranging within the channel. However, if the king coin slide below the 9-day and 21-day moving averages, the first support level could be located at $22,500. Beneath this, critical supports could be found at $19,500, $18,500, and $17,500.
Bitcoin Price Prediction: Will Bitcoin Price Reclaim $23k?
Today’s trading marks another day that the Bitcoin price fails to break to the upside as it looks to set up another few days of a negative price below $23,000. Meanwhile, a break above the opening price of $23,244 would have set the first digital asset up to reach the nearest resistance at the $23,500 level. In other words, traders can see that Bitcoin (BTC) fails to break up as the technical indicator Relative Strength Index (14) moves to cross below the 60-level.
Nevertheless, the Bitcoin price couldn’t go higher as it could head towards the lower boundary of the channel. Though the candle is still yet to close, the bulls may likely end up closing above the opening price of $23,244. Moreover, should the market price stays above the moving averages, any bullish movement above the upper boundary of the channel could meet the resistance levels at $27,000, $28,000, and $29,000.
BTC/USD Medium-term Trend: Ranging (4H Chart)
Looking at the 4-hour chart, the bears are likely to come back into the market as the bulls failed to push the coin higher. However, $22,200 and below may come into play if the bearish momentum increases the market movement and the technical indicator Relative Strength Index (14) crosses below the 40-level, suggesting bearish signals in the market.
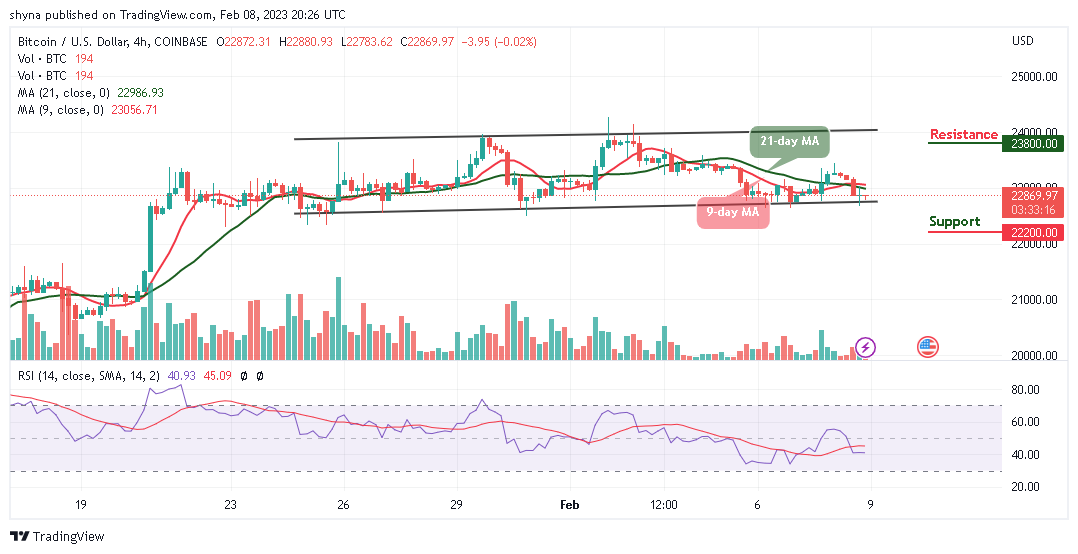
However, if the buyers hijack the current movement and push it upward, traders may expect a retest at a $23,500 resistance level; breaking this level may further allow the bulls to hit the resistance level of $23,800 and above.
Bitcoin Alternatives
The Bitcoin price remained well-bid above the $22,500 support but if the king coin fails to clear the $23,500 resistance, it could start another downside correction. However, Meta Masters Guild (MEMAG) is the latest token in the market, with the sole purpose of creating a mobile gaming ecosystem that lets you earn rewards in exchange for having fun and playing games, is conducting its presale program as almost $4 million has been raised so far.
Join Our Telegram channel to stay up to date on breaking news coverage