
Join Our Telegram channel to stay up to date on breaking news coverage
The Bitcoin price prediction shows that BTC is moving from the opening price of $22,763 as the buying interest may increase on approach to $23,000.
Bitcoin Prediction Statistics Data:
- Bitcoin price now – $19,335
- Bitcoin market cap – $370.6 billion
- Bitcoin circulating supply – 19.2 million
- Bitcoin total supply – 19.2 million
- Bitcoin Coinmarketcap ranking – #1
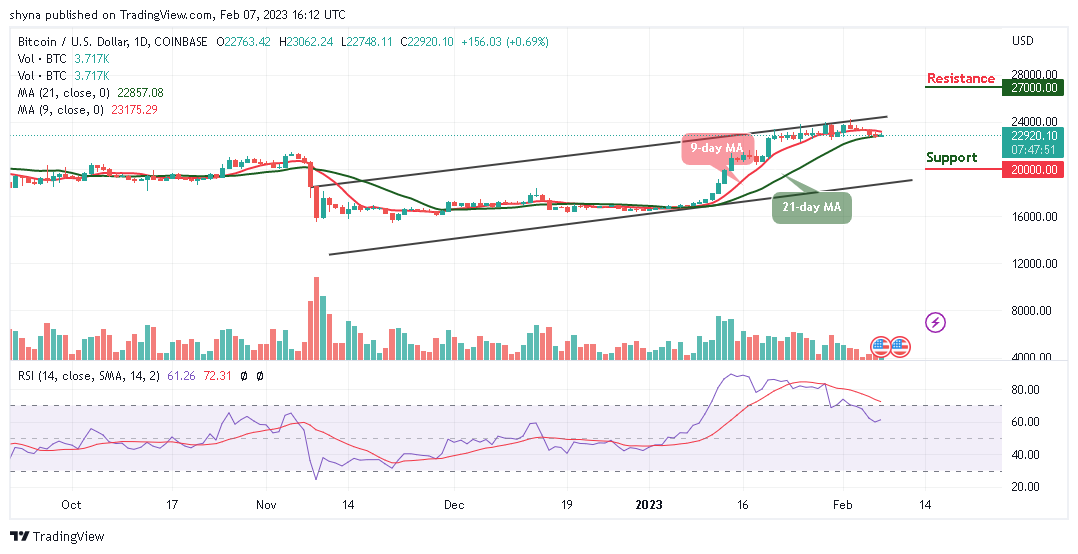
BTC/USD Long-term Trend: Ranging (Daily Chart)
Key levels:
Resistance Levels: $27,000, $28,000, $29,000
Support Levels: $20,000, $19,000, $18,000
BTC/USD is moving sideways as the coin establishes a cross above the resistance level of $23,000 but currently hovering within the overbought region. The buyers may look for some resistance levels if the king coin heads toward the upper boundary of the channel.
Bitcoin Price Prediction: BTC Price May Consolidate Within the Channel
In the past few hours, after the Bitcoin price begins the upward movement, the king coin is now facing the resistance level of $23,000 and looking forward to reclaiming the resistance level of $24,000. However, the daily chart reveals that if the 9-day moving average remains above the 21-day moving average, this will confirm the next direction that the coin will follow. In other words, BTC/USD may decline if the $22,000 support breaks down but the price could rise if the $24,000 resistance is reached.
At the time of writing, the technical indicator Relative Strength Index (14) remains above the 60-level to indicate a bullish movement. Therefore, if the Bitcoin price crosses above the upper boundary of the channel, it could hit the resistance levels of $27,000, $28,000, and $29,000 but any movement toward the lower boundary of the channel could hit the supports at $20,000, $19,000, and $18,000.
BTC/USD Medium-term Trend: Ranging (4H Chart)
According to the 4-hour chart, the Bitcoin price is likely to rise above the 9-day and 21-day moving averages as the technical indicator Relative Strength Index moves above the 40-level. From above, if the Bitcoin price crosses above the moving averages, the bullish influence could spike, and the accrued gains massively.
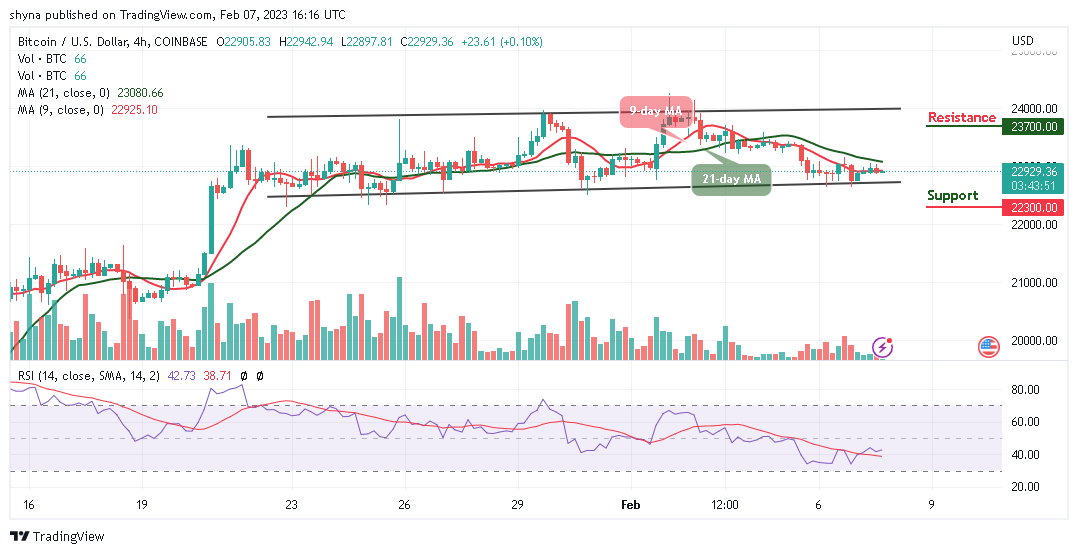
However, the current candle could retreat below the channel and may target the support level of $22,300 and below but the bulls may need to hold above the resistance level of $23,000 and keep their attention on breaking the potential resistance at $23,700 and above.
Bitcoin Alternatives
Looking at the chart, it looks like the Bitcoin price is likely to break out to the downside. However, we can’t say this is a breakout because the bullish momentum is not that strong to move the market farther from the current price level. Meanwhile, a better new signals platform for crypto called MEMAG – Meta Masters Guild has achieved close to $3.5 million in their presale. It will provide excellent retail trading tools to traders.
Join Our Telegram channel to stay up to date on breaking news coverage