Join Our Telegram channel to stay up to date on breaking news coverage
The Bitcoin price prediction shows that BTC could slide below the 21-day moving average if the coin touches $23,500 support.
Bitcoin Prediction Statistics Data:
- Bitcoin price now – $23,615
- Bitcoin market cap – $449.4 billion
- Bitcoin circulating supply – 19.2 million
- Bitcoin total supply – 19.2 million
- Bitcoin Coinmarketcap ranking – #1
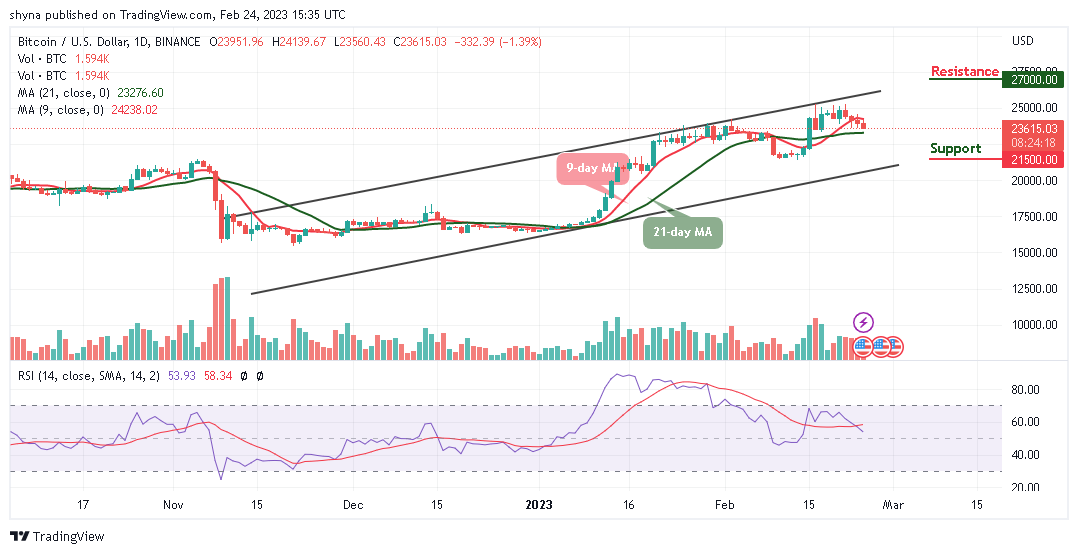
BTC/USD Long-term Trend: Bullish (Daily Chart)
Key levels:
Resistance Levels: $27,000, $28,000 $29,000
Support Levels: $21,500, $22,500, $23,500
BTC/USD could face a setback that could drag the king coin to face the lower boundary of the channel. However, the Bitcoin price is likely to have an additional bearish run as it continues to hover around the $23,615 level.
Bitcoin Price Prediction: Bitcoin (BTC) Could Face the Negative Zone
The Bitcoin price is currently nose-diving below the 9-day moving average as the king coin moves to cross below the 21-day moving average. Therefore, if the market price should slump below the support level of $23,500, it is likely to face more downward trends and the further bearish movement could locate the supports at $21,500, $22,500, and $23,500, making room for BTC to fall even further.
However, the technical indicator Relative Strength Index (14) moves below the 60-level as the trading volume is in support of the bears. Meanwhile, if bulls hold the current market value and push the price back above the 9-day moving average, BTC/USD may cross above the upper boundary of the channel to locate the resistance levels at $27,000, $28,000, and $29,000.
BTC/USD Medium-term Trend: Ranging (4H Chart)
On the 4-Hour chart, the Bitcoin price remains below the 9-day and 21-day moving averages, and the immediate support is likely to come at around the $23,000 level. The price may likely fall below this level if the bears continue to dominate the market.
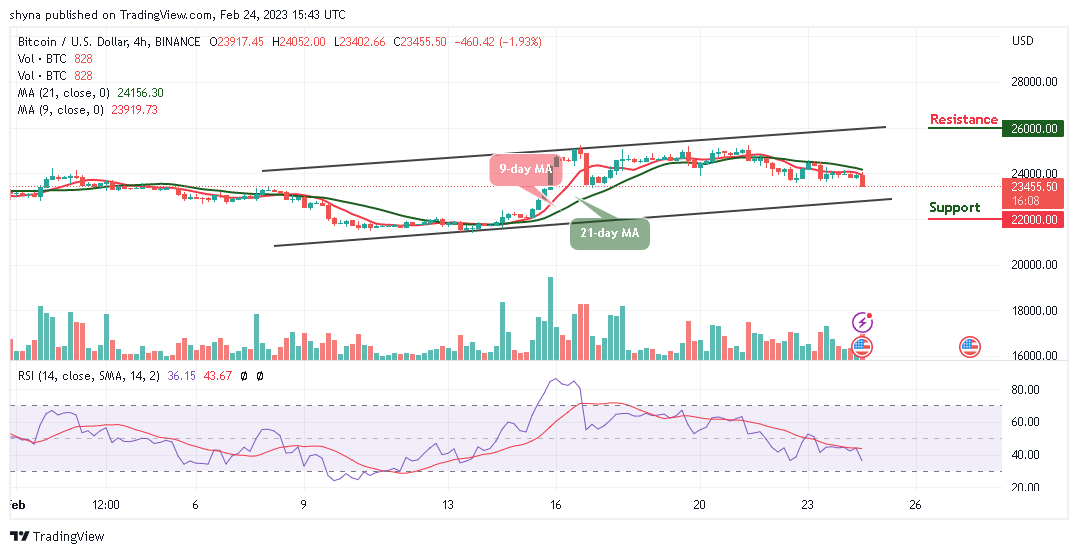
However, a further bearish movement could hit the critical support at the $22,000 level and below, while the resistance is located above the moving averages at the resistance level of $26,000 and above. Meanwhile, the Bitcoin price is currently moving on the negative side as the technical indicator Relative Strength Index (14) crosses below the 40-level.
Bitcoin Alternatives
The Bitcoin (BTC) bulls failed to push the price to the upside, and a prolonged bearish divergence between the price and the RSI indicator increases the likelihood of a short-term correction. However, investors on the hunt for new cryptos to invest in have an excellent opportunity to minimize their risk by including the FGHT tokens and diversifying their portfolio as almost $5 million has been raised so far in the presale. Therefore, buyers are expected to invest in the new coin to enjoy the benefits attached.
Join Our Telegram channel to stay up to date on breaking news coverage