
Join Our Telegram channel to stay up to date on breaking news coverage
With Bitcoin price prediction shooting above $17,000 now, it is doing a little to flip the market sentiment at this stage.
Bitcoin Prediction Statistics Data:
- Bitcoin price now – $16,976
- Bitcoin market cap – $326.1 billion
- Bitcoin circulating supply – 19.2 million
- Bitcoin total supply – 19.2 million
- Bitcoin Coinmarketcap ranking – #1
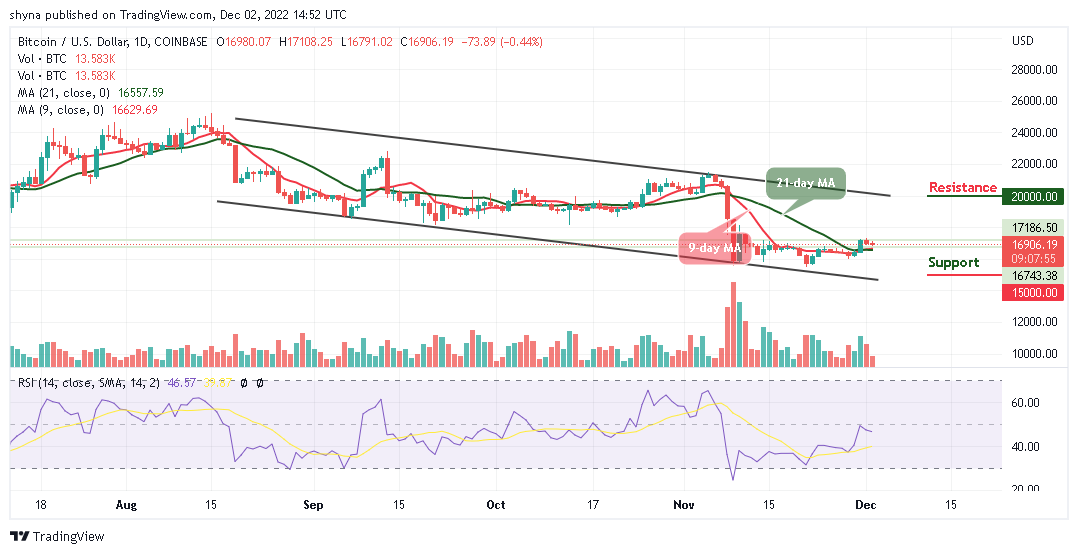
BTC/USD Long-term Trend: Bearish (Daily Chart)
Key levels:
Resistance Levels: $20,000, $22,000, $24,000
Support Levels: $14,000, $12,000, $10,000
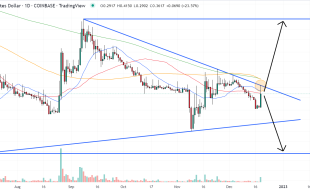
Looking at the daily chart, BTC/USD is correcting gains from $16,398.22 and begins to start a new increase towards the 9-day and 21-day moving averages. During the European session today, the Bitcoin price begins a steady increase above the $17,000 resistance level as the coin touches the daily high at $17,060. Now, BTC/USD is likely to settle towards the upper boundary of the channel.
Bitcoin Price Prediction: Would BTC Price Move Higher?
The Bitcoin price is seen retracing and trading to cross above the 9-day and 21-day moving averages as the market price crosses above the $17,000 resistance which is a sign of bullish momentum. Further increase in the bullish momentum may have to increase the price above this level; another resistance may come at $18,000 before reaching the potential resistance levels of $20,000, $22,000, and $24,000 respectively.
However, if the resistance level of $17,500 failed to hold, it may reverse and face the support level at $16,000; further, an increase in the bears’ pressure may bring down the price below the moving averages and possibly hit the critical supports at $14,000, $12,000, and $10,000. Meanwhile, the technical indicator Relative Strength Index (14) is moving to cross above the 50-level, to increase the buy signals.
BTC/USD Medium-term Trend: Ranging (4H Chart)
According to the 4-hour chart, the Bitcoin price is seen trading above the 9-day and 21-day moving averages at $17,001. However, at the time of writing, BTC/USD is trading towards the upper boundary of the channel but any bearish movement below the lower boundary of the channel could drag the coin to the support at $16,000 and below.
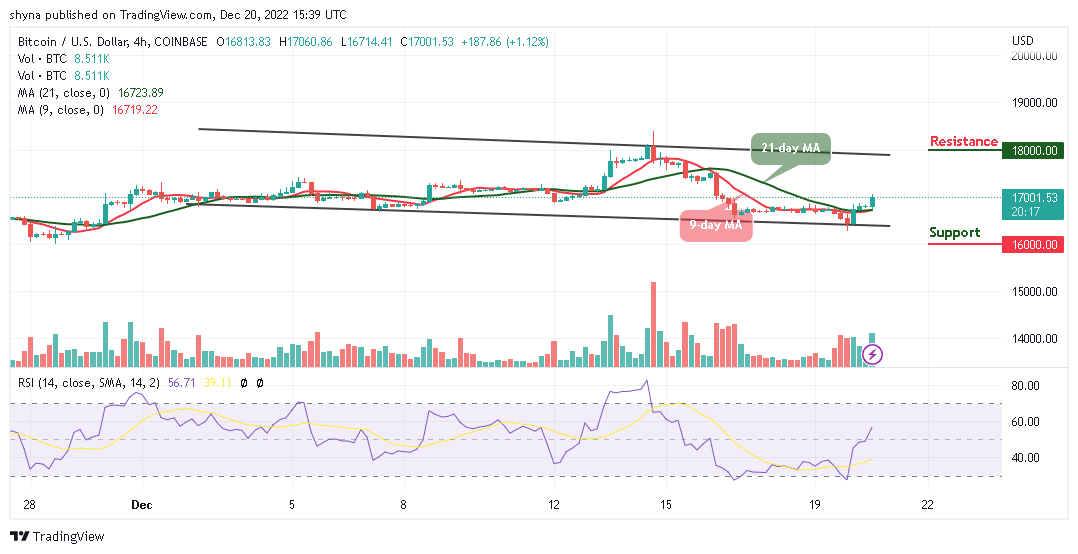
Meanwhile, if Bitcoin (BTC) finds a decent resistance level above the $17,500 level, it could increase the bullish movement which may likely push the price to the resistance level of $18,000 and above. On that note, the technical indicator Relative Strength Index (14) is seen moving to cross above the 60-level, suggesting additional bullish signals into the market.
Nevertheless, Dash 2 Trade gives you the ability to optimize your trading and speculative profitability with effective crypto trading recommendations, auto trading, and analytics features. There is a D2T token presale ongoing and time is running out. The presale dashboard launch is coming soon since the product dev is ahead of the schedule. So far, the presale has raised almost $11 million.
Related
- D2T Price Prediction
- How to Buy D2T
Join Our Telegram channel to stay up to date on breaking news coverage