Join Our Telegram channel to stay up to date on breaking news coverage
The Bitcoin price prediction shows that BTC is hovering below the 9-day moving average as of late, with the daily low being located around the $16,875 level.
Bitcoin Prediction Statistics Data:
- Bitcoin price now – $16,941
- Bitcoin market cap – $326.4 billion
- Bitcoin circulating supply – 19.2 million
- Bitcoin total supply – 19.2 million
- Bitcoin Coinmarketcap ranking – #1
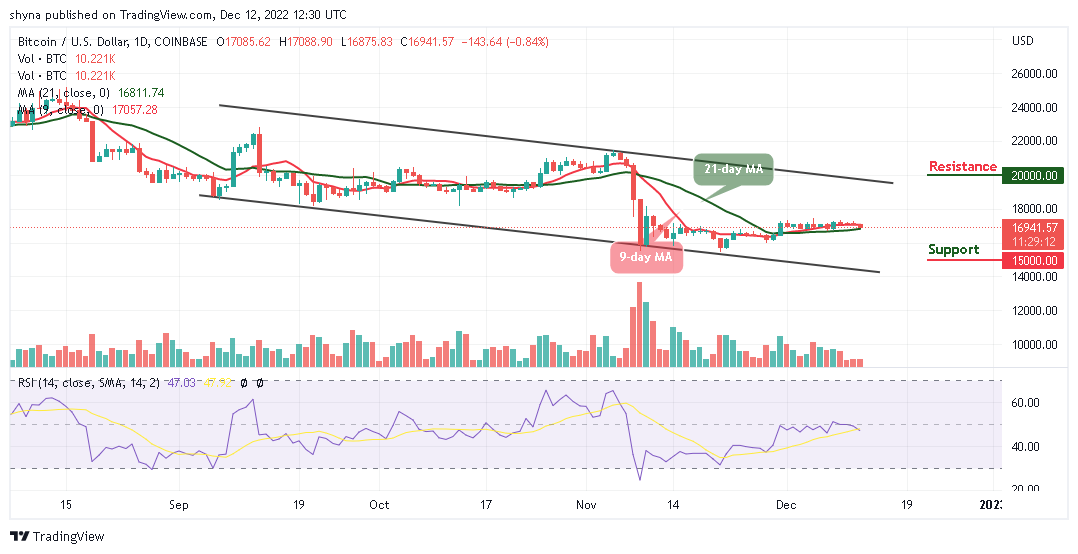
BTC/USD Long-term Trend: Ranging (Daily Chart)
Key levels:
Resistance Levels: $20,000, $22,000, $24,000
Support Levels: $15,000, $13,000, $11,000
BTC/USD is trading bearishly below the 9-day moving average as the coin moves to cross below the 21-day moving average. The king coin is likely to resume a downtrend if the red line of 9-day MA crosses below the green line of 21-day MA. However, until the bulls break above the 9-day moving average, the king coin is likely to face a prolonged sideways move or head toward the south.
Bitcoin Price Prediction: Bitcoin (BTC) May Fall to rising Again
At the time of writing, the Bitcoin price is trading up with a loss of 0.84% at its current price of $16,941. However, the current market movement could mark a slight decline, and the coming days may bring the price to the negative side, as it could slide below the 21-day moving average.
Nevertheless, Bitcoin (BTC) remains within the moving averages, with bears bringing the price toward the south, any further bearish movement toward the lower of the channel may bring the price to the support levels of $15,000, $13,000, and $11,000 while the resistance levels could be located at $20,000, $22,000, and $24,000 while the technical indicator Relative Strength Index moves below the 50-level.
BTC/USD Medium-term Trend: Ranging (4H Chart)
The 4-hour chart reveals that the resistance at $18,000 has been too heavy for the bulls to overcome as the price struggles in a consolidation mode, and this has made the cryptocurrency remain on the downside. Meanwhile, as the coin trades below the 9-day and 21-day moving average, crossing below the lower boundary of the channel could hit the support at $17,500 and below.
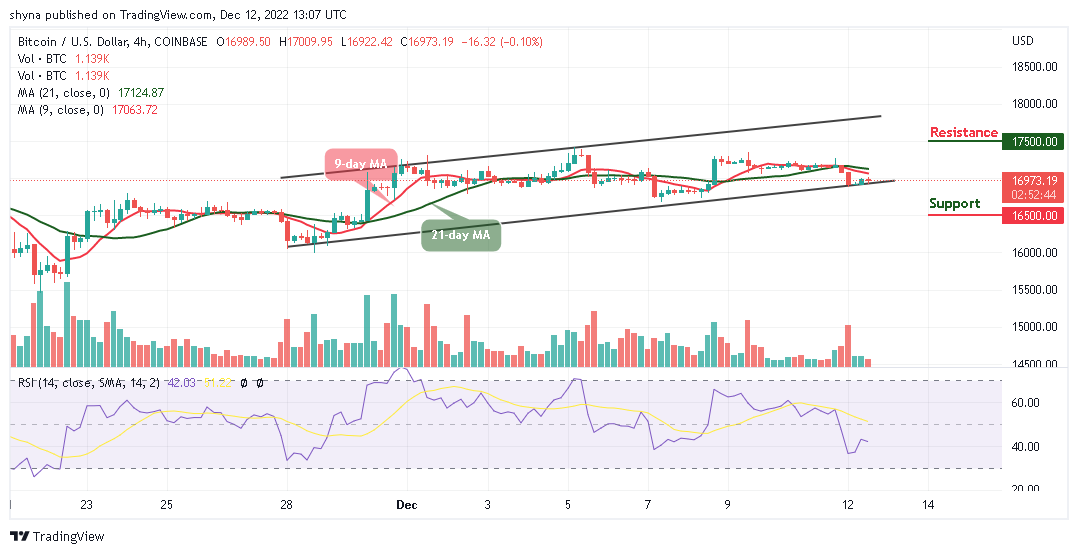
However, the Bitcoin price is roaming around $16,973 as bulls couldn’t push the price above the 9-day and 21-day moving averages. Moreover, the resistance level of $17,500 and above may come into play if the technical indicator Relative Strength Index (14) crosses above the 50-level but currently hovering at the downside.
Meanwhile, Dash 2 Trade aims to guide all trades to speculate more proficiently. This is because effective risk control parameters are necessary for building robust strategies for initiating winning trades. There is a D2T presale ongoing and time is running out. The presale dashboard launch is coming soon since the product dev is ahead of the schedule. So far, the presale has raised almost $9.5 million.
Related
- D2T Price Prediction
- How to Buy D2T
Join Our Telegram channel to stay up to date on breaking news coverage