Join Our Telegram channel to stay up to date on breaking news coverage
The Bitcoin price prediction shows that BTC keeps trading below the moving averages as the coin touches $27,273 support.
Bitcoin Prediction Statistics Data:
- Bitcoin price now – $27,597
- Bitcoin market cap – $532.5 billion
- Bitcoin circulating supply – 19.3 million
- Bitcoin total supply – 19.3 million
- Bitcoin Coinmarketcap ranking – #1
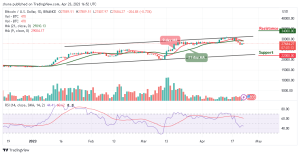
BTC/USD Long-term Trend: Ranging (Daily Chart)
Key levels:
Resistance Levels: $33,000, $35,000 $37,000
Support Levels: $23,000, $21,000, $19,000
BTC/USD is facing a setback as this could keep the market price below the 9-day and 21-day moving averages. However, the king coin is likely to have a bearish run in the short-term but a price rally may help the coin to head to the south as the red line of the 9-day moving average is crossing below the green line of the 21-day moving average. Currently, Bitcoin (BTC) is trading around $27,597 level after a free fall from $27,863 during the European session and the coin has been moving sideways over the past few days.
Bitcoin Price Prediction: Bitcoin (BTC) May Follow the Downtrend
Looking at the daily chart, the Bitcoin price is currently ranging below the 9-day and 21-day moving averages. If the price should slump below the support level of $26,000, the king coin is likely to face a downward trend. However, the further bearish movement could locate the supports at $23,000, $21,000, and $19,000, making room for BTC to fall even further.
In the meantime, the technical indicator Relative Strength Index (14) is likely to cross below the 40-level as the trading volume could support the bears. Moreover, if the bulls decide to move the price above the 9-day and 21-day moving averages, BTC/USD may likely cross above the upper boundary of the channel to locate the resistance levels at $33,000, $35,000, and $37,000.
BTC/USD Medium-term Trend: Bearish (4H Chart)
On the 4-Hour chart, the Bitcoin price will likely cross above the 9-day and 21-day moving averages. The first digital asset could fall below the lower boundary of the channel if the bears fully stepped back into the market.
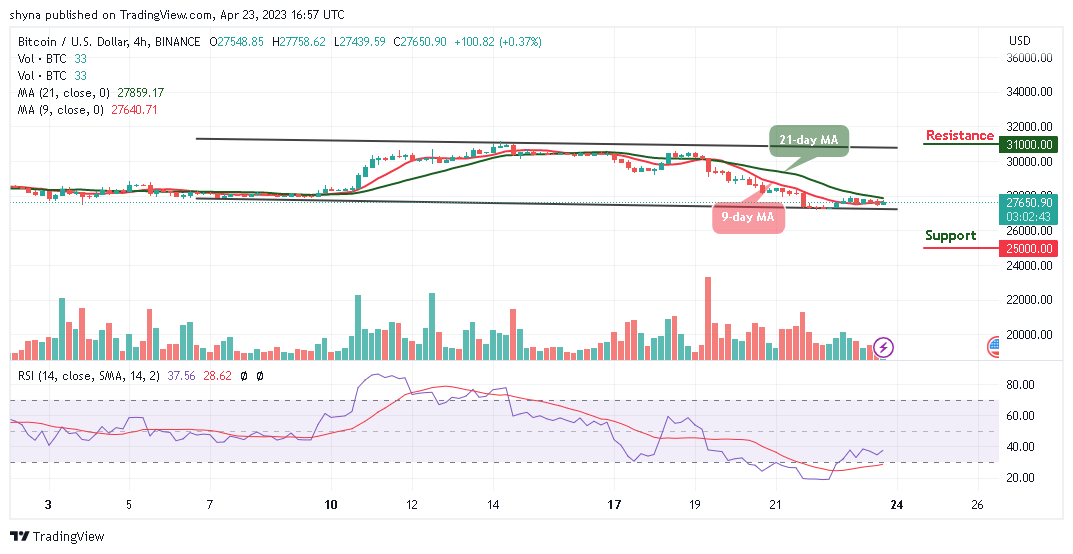
However, a further bearish movement could test the critical support at the $25,500 level and below while the resistance could be located above the moving averages at the resistance level of $29,500 and above. Technically, the Bitcoin price is currently moving on the positive side as the technical indicator Relative Strength Index (14) moves to cross above the 50-level.
Bitcoin Alternatives
The Bitcoin price is likely to drop from the current level at $27,597 as the bulls keep struggling to overcome the important $28,000 level. However, the stagnation near the 9-day moving average shows that the coin is unable to increase volume to keep the market to the upside and overcome key hurdles with confidence. Nonetheless, the Love Hate Inu project has hit upon a viral formula that everyone can understand: vote on the people and things you love or hate. Meanwhile, the token has already raised almost $7 in the presale as interested buyers are expected to invest in the token.
Read more:
- Top Bitcoin Price Predictions
Join Our Telegram channel to stay up to date on breaking news coverage