Join Our Telegram channel to stay up to date on breaking news coverage
The Bitcoin price prediction reveals that BTC continues to head to the downside as its price moves below $29k to touch the new low of $28,119.
Bitcoin Prediction Statistics Data:
- Bitcoin price now – $28,296
- Bitcoin market cap – $546.4 billion
- Bitcoin circulating supply – 19.3 million
- Bitcoin total supply – 19.3 million
- Bitcoin Coinmarketcap ranking – #1
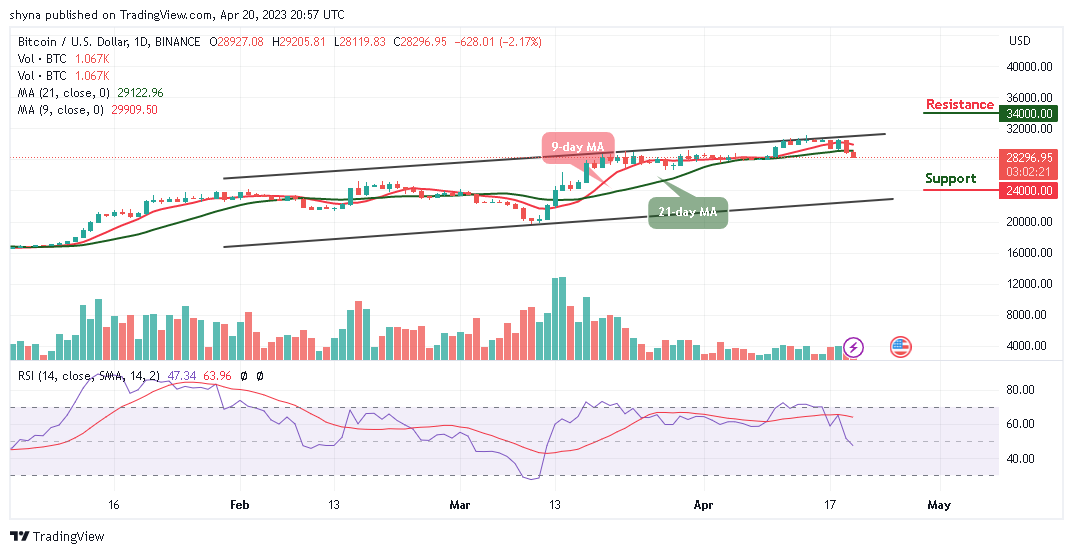
BTC/USD Long-term Trend: Ranging (Daily Chart)
Key levels:
Resistance Levels: $34,000, $36,000, $38,000
Support Levels: $24,000, $22,000, $20,000
BTC/USD is trading around $28,296 below the 9-day and 21-day moving averages. Looking at the daily chart, Bitcoin (BTC) bears now step back into the market, it is likely to bring the coin below the support level of $28,000. However, the king coin is now plunging below the former resistance level of $29,000 which may cause many investors to take profits off the table.
Bitcoin Price Prediction: Would Bitcoin (BTC) Break More Downs?
The Bitcoin price is currently changing hands at $28,296, however, where BTC trends next may partly depend on whether or not buyers can close today’s candle above the $29,000 level. Should in case this comes to play, the bulls may propel prices higher, and then traders may expect the king coin to rise above the $31,000 resistance, which could later move towards the potential resistance levels at $34,000, $36,000, and $38,000.
On the other hand, if the Bitcoin price failed to close above the $29,000 level; the price could drop toward the lower boundary of the channel and a low drive could send the price to $24,000, $22,000, and $20,000 supports. Meanwhile, the technical indicator Relative Strength Index (14) has recently revealed a sign of trend reversal as the signal line shows a possible bearish momentum within the clients.
BTC/USD Medium-term Trend: Ranging (4H Chart)
Looking at the 4-hour chart, following the rejection of $28,441, BTC/USD is trading below the 9-day and 21-day moving averages. Looking at it from above, if Bitcoin holds above $28,000, the next level of resistance could be $31,000 and above.
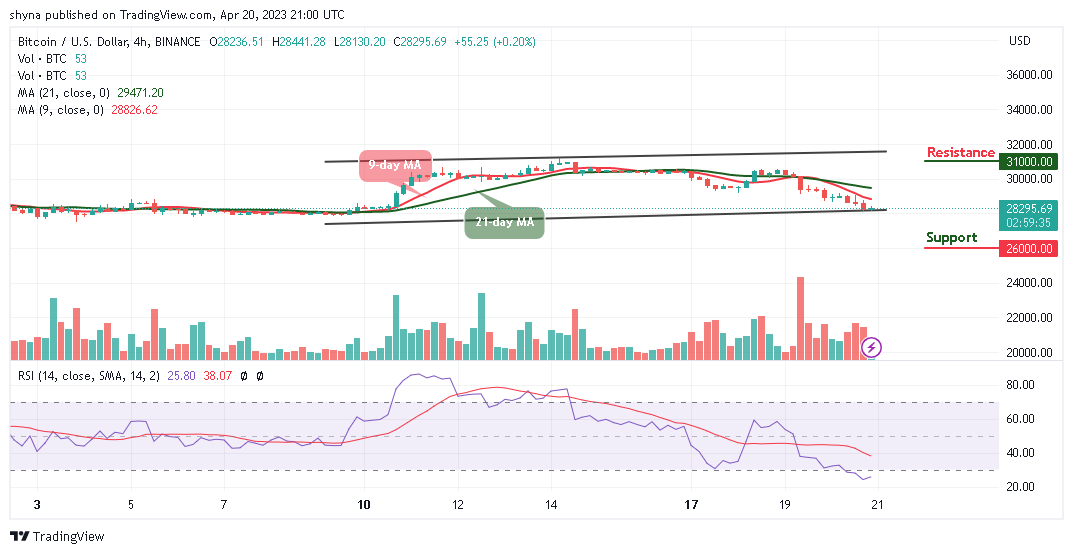
Meanwhile, as the technical indicator Relative Strength Index (14) slides into the oversold region, this might have signaled a temporary end to the bullish trend of Bitcoin, and if the coin falls below the lower boundary of the channel, the market price could reach the support level of $26,000 and below.
Alternatives to Bitcoin
According to the daily chart, Bitcoin (BTC) may struggle to close above $29,000 and if it does, it should be free to rise well above $31,000. Meanwhile, the king coin has been struggling to break above the upper boundary of the channel but if the bulls step into the market, the Bitcoin price could face the upside, else, the sellers may dominate the market. However, Love Hate Inu is creating a safe space for people to share their opinions with other people who care what they think, and who don’t criticize them for having that opinion. From an investment standpoint, Love Hate Inu is a good buy as almost $5 million has been raised so far in the ongoing presale.
Join Our Telegram channel to stay up to date on breaking news coverage