Join Our Telegram channel to stay up to date on breaking news coverage
The Bitcoin price prediction shows that BTC may begin to drop below the moving averages as the coin faces the south.
Bitcoin Prediction Statistics Data:
- Bitcoin price now – $29,320
- Bitcoin market cap – $564.6 billion
- Bitcoin circulating supply – 19.3 million
- Bitcoin total supply – 19.3 million
- Bitcoin Coinmarketcap ranking – #1
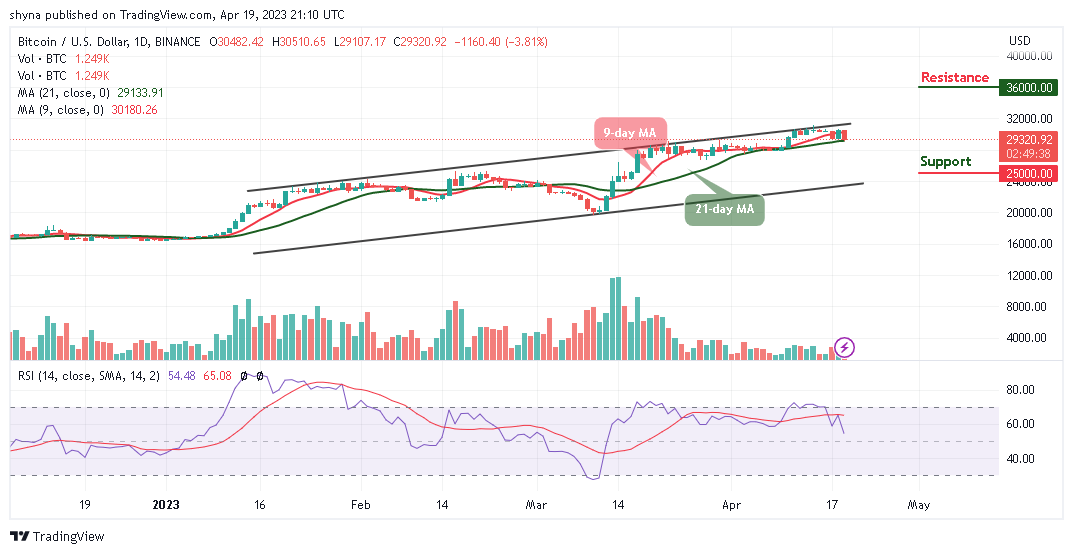
BTC/USD Long-term Trend: Bullish (Daily Chart)
Key levels:
Resistance Levels: $36,000, $38,000 $40,000
Support Levels: $25,000, $23,000, $21,000
BTC/USD may face a setback that could drag the coin toward the lower boundary of the channel, and the king coin is likely to have an additional bearish run if the sellers increase the pressure. At the moment, Bitcoin (BTC) is trading around the $29,320 level.
Bitcoin Price Prediction: Bitcoin (BTC) Could Fall into the Negative Zone
The Bitcoin price is likely to cross below the 21-day moving average before heading toward the lower boundary of the channel. If the market price were to break below the $29,000 support level, it is likely to face more downtrends. Meanwhile, the further bearish movement could locate supports at $25,000, $23,000, and $21,000, making room for BTC to fall further.
Moreover, the technical indicator Relative Strength Index (14) is moving below the 60-level as the trading volume is in support of the bears. Meanwhile, if bulls push the price back above the upper boundary of the channel, BTC/USD may move toward the upside to locate the resistance levels at $36,000, $38,000, and $40,000.
BTC/USD Medium-term Trend: Ranging (4H Chart)
On the 4-Hour chart, the Bitcoin price keeps hovering below the 9-day and 21-day moving averages, but the immediate support is likely to come at around the $29,000 level. The price may likely fall below this level if the bears continue to dominate the market.
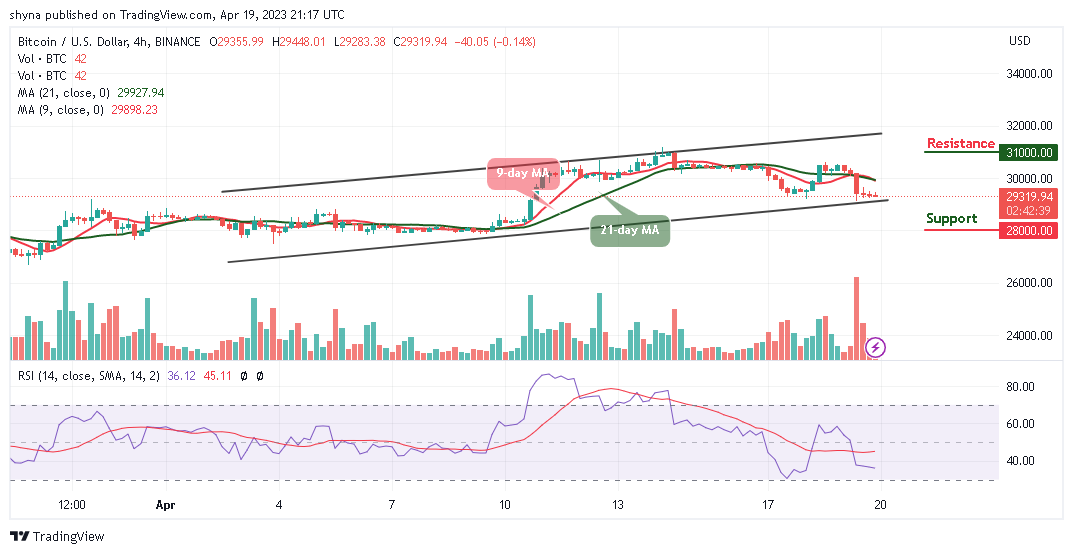
However, a further bearish movement could hit the critical support at $28,000 and below, while the resistance could be found above the 9-day moving average at the resistance level of $31,000 and above. Meanwhile, the Bitcoin price may continue to face the negative side as the technical indicator Relative Strength Index (14) stays below the 40-level.
Bitcoin Alternatives
The Bitcoin price may continue to face a setback that could make the king coin retreat and it is likely to have an additional bearish run in a few days. However, a price rally may help the coin to face the south if the red line of the 9-day moving average crosses below the green line of the 21-day moving average. Nonetheless, if there’s one fact about social media, it’s that people love sharing their opinions on it. True, sometimes those opinions get attacked and ridiculed, which is never a good thing, but people keep on sharing with the world what they think of certain topics. Moreover, buying the Love Hate Inu token is a good buy because of the viral nature of the platform and almost $5 million has been raised in the ongoing presale.
Join Our Telegram channel to stay up to date on breaking news coverage