Join Our Telegram channel to stay up to date on breaking news coverage
The Bitcoin price prediction shows that BTC is moving from the opening price of $29,502 as the buying interest increases on the approach to $31,000.
Bitcoin Prediction Statistics Data:
- Bitcoin price now – $30,297
- Bitcoin market cap – $585.5 billion
- Bitcoin circulating supply – 19.3 million
- Bitcoin total supply – 19.3 million
- Bitcoin Coinmarketcap ranking – #1
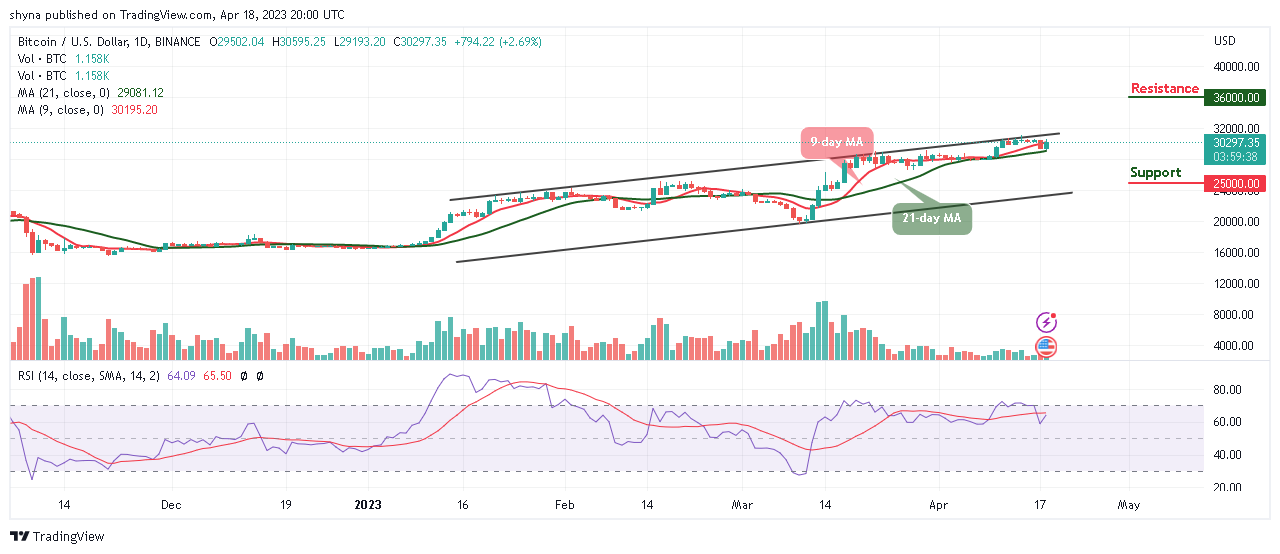
BTC/USD Long-term Trend: Bullish (Daily Chart)
Key levels:
Resistance Levels: $36,000, $38,000, $40,000
Support Levels: $25,000, $23,000, $21,000
BTC/USD is moving sideways as the coin establishes a cross above the resistance level of $30,000 but currently hovering at $30,297. The buyers may look for some resistance levels if the king coin crosses above the upper boundary of the channel.
Bitcoin Price Prediction: BTC Price May Consolidate Within the Channel
In the past few hours, after the Bitcoin price begins the upward movement, the king coin is now facing the resistance level of $31,000 and looking forward to reclaiming the resistance level of $30,600. However, the daily chart reveals that if the 9-day moving average remains above the 21-day moving average, this will confirm the next direction that the coin will follow. Nonetheless, BTC/USD may decline if the $29,000 support breaks down but the price could rise if the $31,000 resistance is reached.
At the time of writing, the technical indicator Relative Strength Index (14) remains above the 60-level to indicate a bullish movement. Therefore, if the Bitcoin price crosses above the upper boundary of the channel, it could hit the resistance levels of $36,000, $38,000, and $40,000 but any movement toward the lower boundary of the channel could hit the supports at $25,000, $23,000, and $21,000.
BTC/USD Medium-term Trend: Ranging (4H Chart)
According to the 4-hour chart, the Bitcoin price is likely to rise toward the upper boundary of the channel as the technical indicator Relative Strength Index remains above the 50-level. From above, if the Bitcoin price moves near the upper boundary of the channel, the bullish influence could spike, and the accrued gains massively.
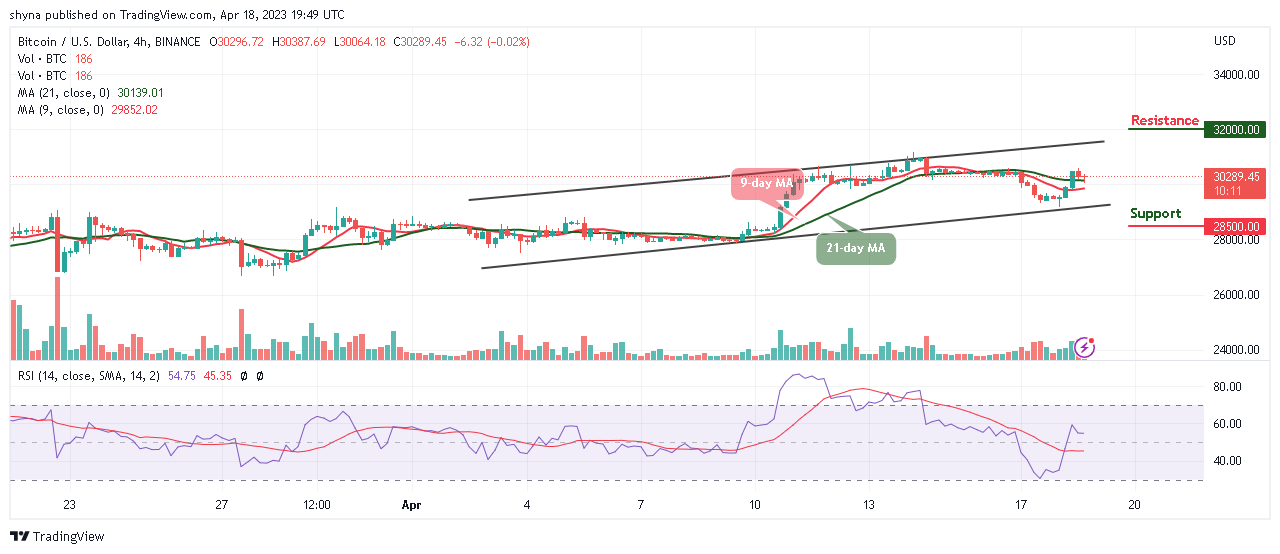
However, the current candle could retreat below the channel and may target the support level of $28,500 and below but the bulls may need to hold above the resistance level of $30,500 and keep their attention on breaking the potential resistance at $32,000 and above.
Alternatives to Bitcoin
The Bitcoin price is seen retracing and trading above the 21-day moving average as the market price heads to the upside. However, any further increase in the bullish movement above the upper boundary of the channel could push the coin to the resistance at $31,000. Meanwhile, Love Hate Inu (LHINU) token is created for the people who want their voices heard. The users will have access to User Interface, where they can connect their wallet and also clearly see the votes that will be updated in real-time. People who wish to share their vote ideas can easily do it through the Vote Submission platform. The presale is progressing swiftly, and the token has raised almost $5 million, so this is your chance to grab LHINU tokens at a discounted price while you can!
Join Our Telegram channel to stay up to date on breaking news coverage