Join Our Telegram channel to stay up to date on breaking news coverage
The Bitcoin price prediction shows BTC sliding towards the downside as the cryptocurrency touches the $29,322 low.
Bitcoin Prediction Statistics Data:
- Bitcoin price now – $29,581
- Bitcoin market cap – $570.8 billion
- Bitcoin circulating supply – 19.3 million
- Bitcoin total supply – 19.3 million
- Bitcoin Coinmarketcap ranking – #1
BTC/USD Long-term Trend: Bullish (Daily Chart)
Key levels:
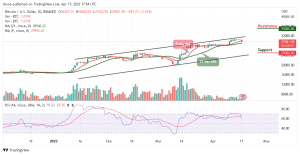
Resistance Levels: $35,000, $37,000, $39,000
Support Levels: $25,000, $23,000, $21,000
BTC/USD is dropping with a loss of 2.81% today as the cryptocurrency falls beneath the opening price of $30,437 level to reach the daily low of $29,322. However, the daily chart reveals that $29,000 is a very important area as it is expected to provide strong support for the coin.
Bitcoin Price Prediction: Bitcoin Price May Cross Below $29k
The Bitcoin price is likely to cross below the 21-day moving average at support provided by the trend line. A breakdown below this barrier could cause the Bitcoin price to create a new low below the $29,000 level. However, a drop towards the lower boundary of the channel could be detrimental to Bitcoin as it could lead the coin towards the supports at $25,000, $23,000, and $21,000.
Moreover, if the buyers can rebound from the current support level of $29,581, the first level of resistance could be located at $30,500. Above this, further resistance is expected at $31,000. This may likely follow by the potential resistance at $35,000, $37,000, and $39,000 levels. Therefore, if the coin can break above these levels, then the market may be on the verge of turning bullish in the long term. Presently, the Relative Strength Index (14) is likely to cross below the 60-level, indicating that more bearish signals might come to play.
BTC/USD Medium-term Trend: Bullish (4H Chart)
According to the 4-hour chart, the Bitcoin price is seen hovering at $29,573 as the coin remains below the 9-day and 21-day moving averages. However, if the bulls decide to push the market price above the moving averages, it could hit the resistance at $32,000 and above.
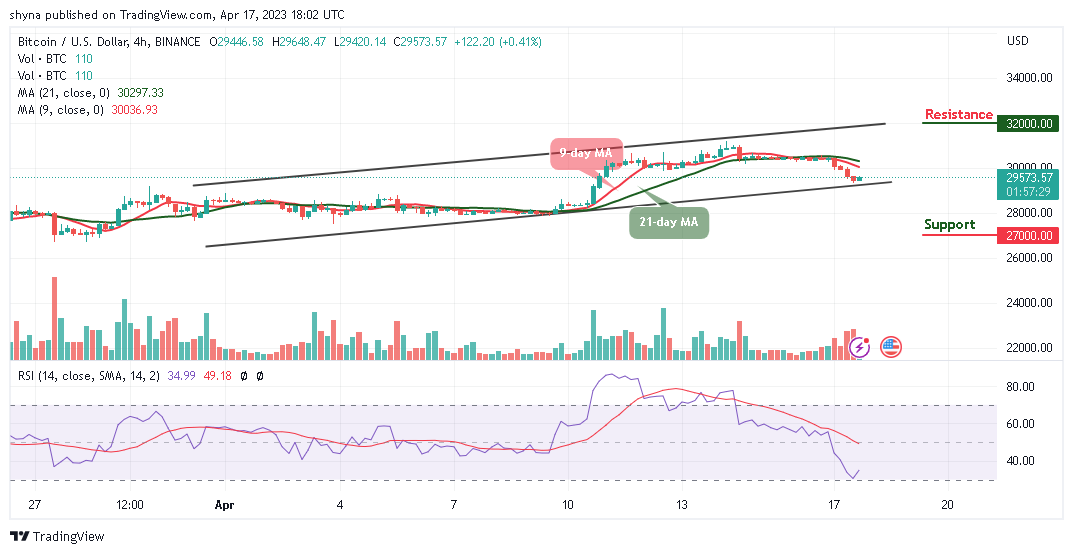
Nevertheless, it now appears that the cryptocurrency is at risk of seeing further downside as the multiple attempts to shatter its $29,000 support seem to indicate that bears are building momentum. As the Relative Strength Index (14) remains below the 35-level, the king coin may locate critical support at $27,000 and below.
Bitcoin Alternatives
The Bitcoin price begins to face a setback that could be a permanent one. The king coin is likely to have an additional bearish run but a price rally may help the coin to head to the south as the red line of the 9-day moving average could go below the green line of the 21-day moving average. Meanwhile, Love Hate Inu seeks to harness its Ethereum blockchain technology by providing immutable and secure poll and survey results that cannot be manipulated in any form. However, the token has raised almost $5 million in the ongoing presale and investors are expected to take a bold step in investing in the token.
Join Our Telegram channel to stay up to date on breaking news coverage