

Join Our Telegram channel to stay up to date on breaking news coverage
Bitcoin (BTC) Price Prediction – March 4
BTC/USD broke beneath the 9-day MA and went lower but looking at the daily chart, the coin is now trying to recover as it attempts to break back above.
BTC/USD Long-term Trend: Bullish (Daily Chart)
Key levels:
Resistance Levels: $9,400, $9,600, $9,800
Support Levels: $8,000, $7,800, $7,600
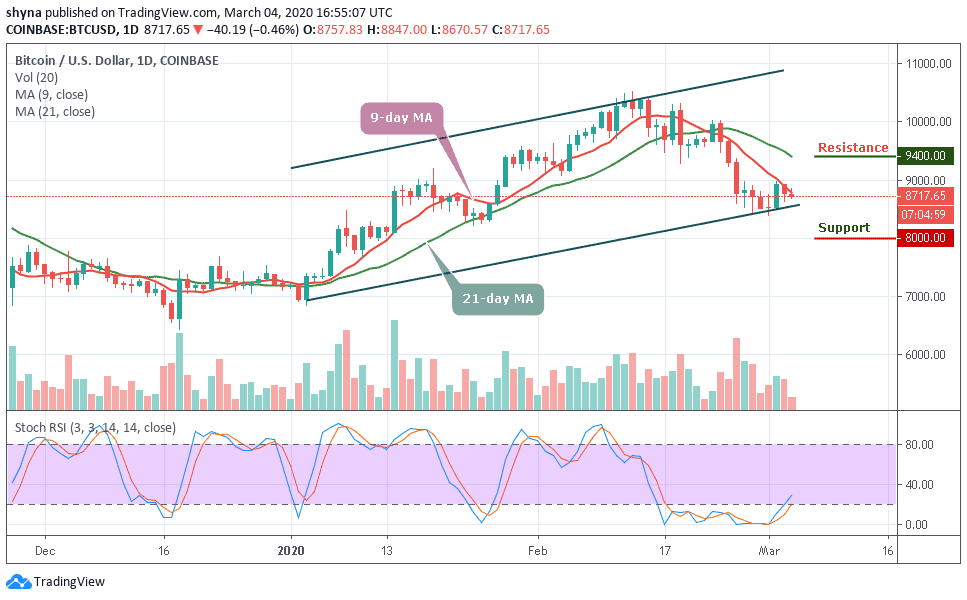
After the previous price fall that was caused when BTC/USD was unable to break above $10,000, the cryptocurrency is now attempting to rebound higher. A few days ago, Bitcoin (BTC) managed to find support at $8,391 and now making its way toward the $9,000 region again. Moreover, despite all the recent declines in price, the Bitcoin (BTC) still remains up as the bullish run continues to drive prices higher.
However, Bitcoin is currently neutral at this moment in time and it may prevent itself from turning bearish if the coin can manage to break back above $8,900 pretty quickly. Similarly, for the coin to start creating a short term bullish trend, it would need to break above $9,000. More so, if the bulls push higher, the first level of resistance lies at $9,200. Above this, resistance is located at $9,400, $9,600 and $9,800.
On the other hand, if the sellers push lower, support lies at $8,000, $7,800 and $7,600. If the selling continues, another support lies at $7,500. Meanwhile, as the daily chart reveals, the stochastic RSI is suggesting an upward movement for the coin where the signal lines are making an attempt to move out of the oversold condition.
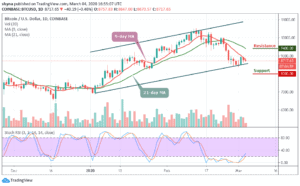
BTC/USD Medium – Term Trend: Bearish (4H Chart)
The 4-hour chart reveals that the market is showing a sign of weakness as the price couldn’t move above the moving averages. However, the intraday trading is looking bullish; following the recent rebound at $8,680 which is the key support level. The next key support levels lie at $8,400, $8,200 and $8,000.

However, considering the recent sharp rebound, the Bitcoin price may re-enter the bullish rally to $8,900 resistance. A climb above the mentioned resistance may further push BTC price to $9,100, $9,300 and $9,500 resistance levels. As it appeared now, it seems the bears may likely return into the market as the stochastic RSI is now moving into the oversold zone and could continue the downward direction.
Please note: Insidebitcoins.com is not a financial advisor. Do your research before investing your funds in any financial asset or presented product or event. We are not responsible for your investing results.
Join Our Telegram channel to stay up to date on breaking news coverage
