Join Our Telegram channel to stay up to date on breaking news coverage
ETH Price Prediction – March 4
In the early hours of today, the price of Ethereum fell from $229 to $221 support level.
ETH/USD Market
Key Levels:
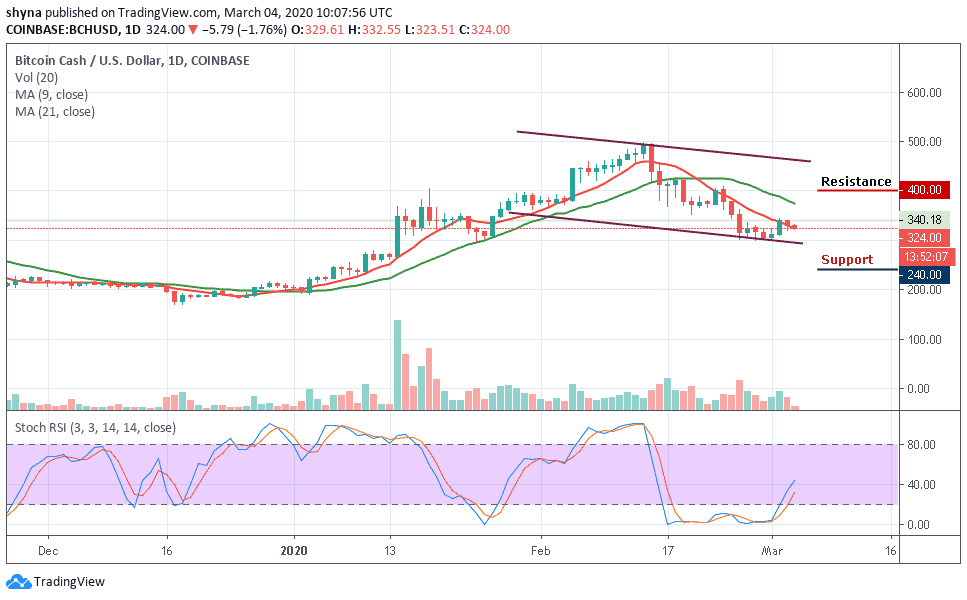
Resistance levels: $255, $260, $265
Support levels: $190, $185, $180

At the moment, the market is falling as ETH/USD could not climb much higher from the $220 level within the ascending channel. This decline is largely attributed to the fact that ETH/USD plummeted pretty significantly. ETH/USD remains below the 9-day and 21-day MAs but it can rise higher and break above this month’s high at around $234.52. If ETH/USD falls and drops beneath the support at $217, the coin may turn bearish.
However, if the sellers continue to add downward pressure to ETH, initial support is expected at $190. Beneath this, support can be found at $185 and $180. On the other hand, if the bulls can defend the $210 level and allow ETH to rebound, an initial resistance is located at $240. Above this, additional resistance is expected at $255, $260 and $265.
More so, the stochastic RSI is within the oversold zone showing that the previous bearish momentum is starting to fade. If the technical indicator manages to move above the 20-level then the bulls stand a chance to allow Ethereum to rebound at $230. However, if it penetrates beneath, the cryptocurrency may resume a downward spiral.
Against Bitcoin, the market price remained in the ascending channel as the coin moves in sideways. ETH/BTC is currently trading at the level of 0.0255 BTC and the bulls couldn’t push the price above the 9-day and 21-day moving averages. Looking at the chart, if the market continues to drop, the next key supports may likely be at 0.023 BTC and below.
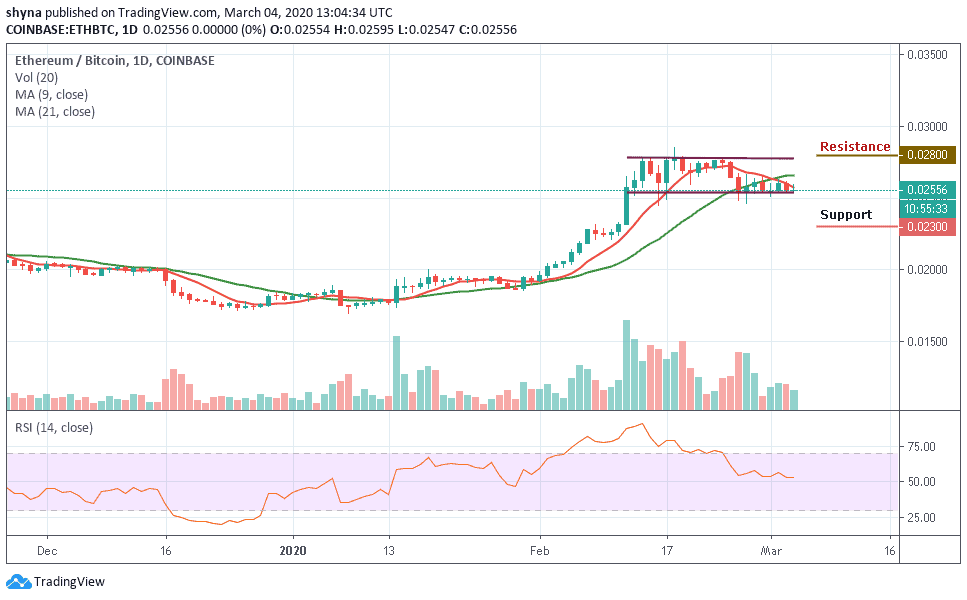
Considering the upside, a possible bullish movement may push the market above the moving averages, when this is done, the resistance level of 0.028 BTC and above may be visited. The RSI (14) is moving in the same direction and this indicates an indecisive in the market movement.
Please note: Insidebitcoins.com is not a financial advisor. Do your research before investing your funds in any financial asset or presented product or event. We are not responsible for your investing results.
Join Our Telegram channel to stay up to date on breaking news coverage