Join Our Telegram channel to stay up to date on breaking news coverage
Bitcoin (BTC) Price Prediction – July 14, 2020
Bitcoin has been fluctuating between levels $9,100 and $9,200 after rejection from the $9,300 resistance. For the past five days, BTC/USD has been hovering above $9,200 support. Each time price retests the $9,300 resistance, the market will fall and hover above $9,200. Despite the price retracement, the $9,000, and $9,200 support is holding to resolve the upside range trading.
Key Levels:
Resistance Levels: $10,000, $11, 000, $12,000
Support Levels: $7,000, $6,000, $5,000

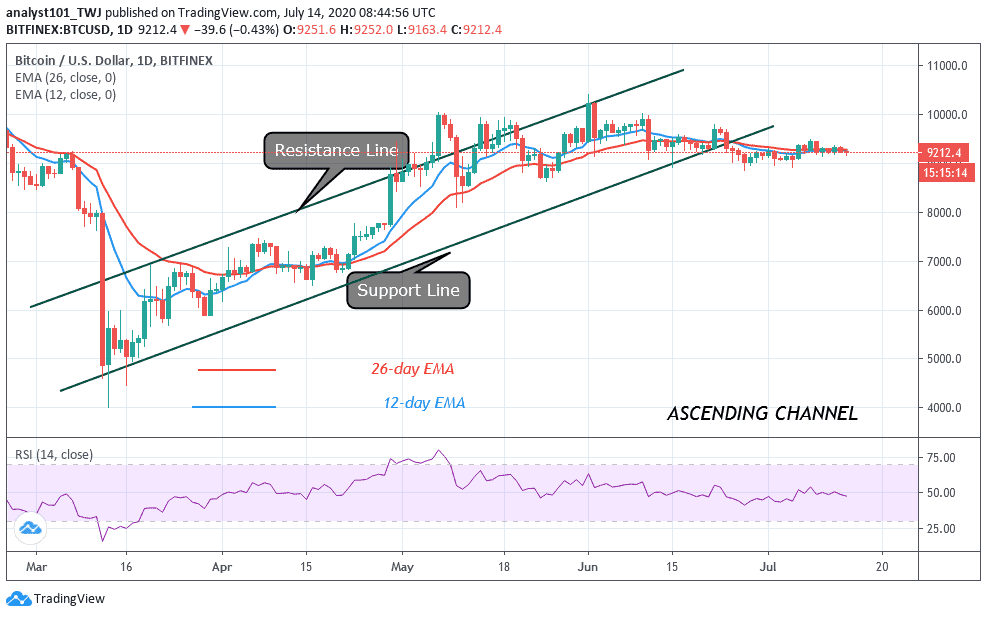
On the daily chart, the price action is characterized by small indecisive candlesticks as the market consolidates in a tight range. The candlesticks describe that buyers and sellers are undecided where Bitcoin will trend. BTC has dropped to $9,100 low. Nonetheless, if the bears break the $9,000 support, BTC will be in a downward move. The market will not be the upside range trading. In a downtrend, BTC’s first support will be at a low of $8,800 or $8,500.
Nevertheless, where these support levels are broken, BTC will further drop to $8,200 or $8,100. On the other hand, if the current downward move holds above $8,900, the BTC upside range will resume. The $9,000 and $9,200 support must hold for the king coin to consolidate between $9,000 and $10,000. In the meantime, Bitcoin is hovering above $9,200 at the time of writing. Meanwhile, BTC has fallen to level 46 of the Relative Strength Index period 14. It indicates that the coin is in the downtrend zone and below the centerline 50.
BTC/USD Medium-term Trend: Bullish (4-Hour Chart)

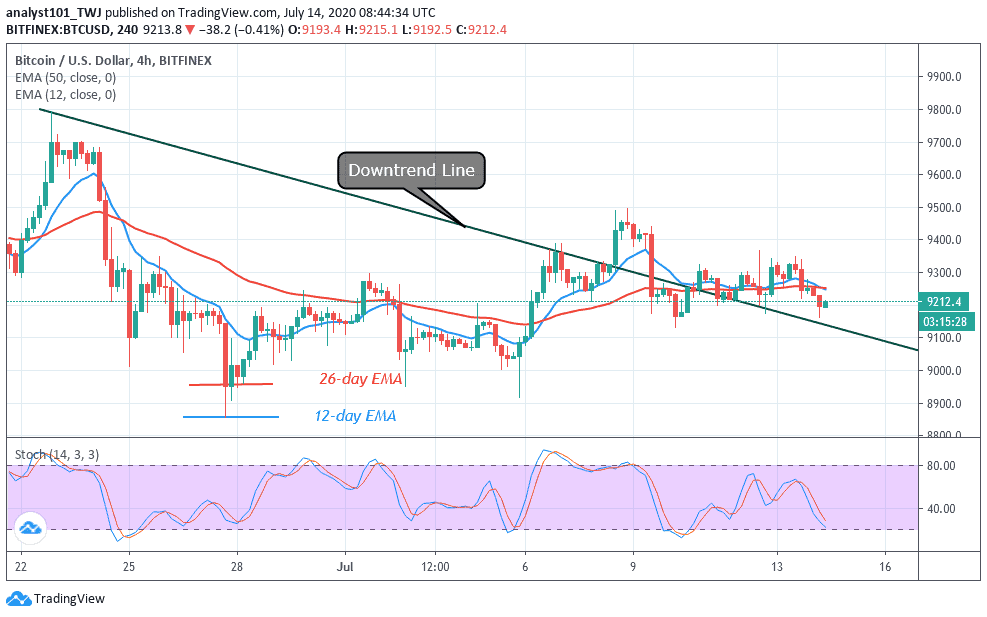
On the 4 hour chart, BTC is in a tight range between $9,000 and $9,300. The price was repelled at the $9,300 resistance on four occasions before dropping to $9,100. The downward move has subsided as price tests the downtrend line. On the downside, if the bears break below the downtrend line, the selling pressure will persist. BTC will rise if it tests and finds support above the trend line. Meanwhile, BTC is below 40 % range of the daily stochastic. It indicates that BTC is in a bearish momentum but the momentum is subsiding.
Join Our Telegram channel to stay up to date on breaking news coverage

