Join Our Telegram channel to stay up to date on breaking news coverage
Bitcoin (BTC) Price Prediction – May 21
BTC/USD likely to consolidate at lower levels; $9,200 and $9,000 based on the prevailing technical levels.
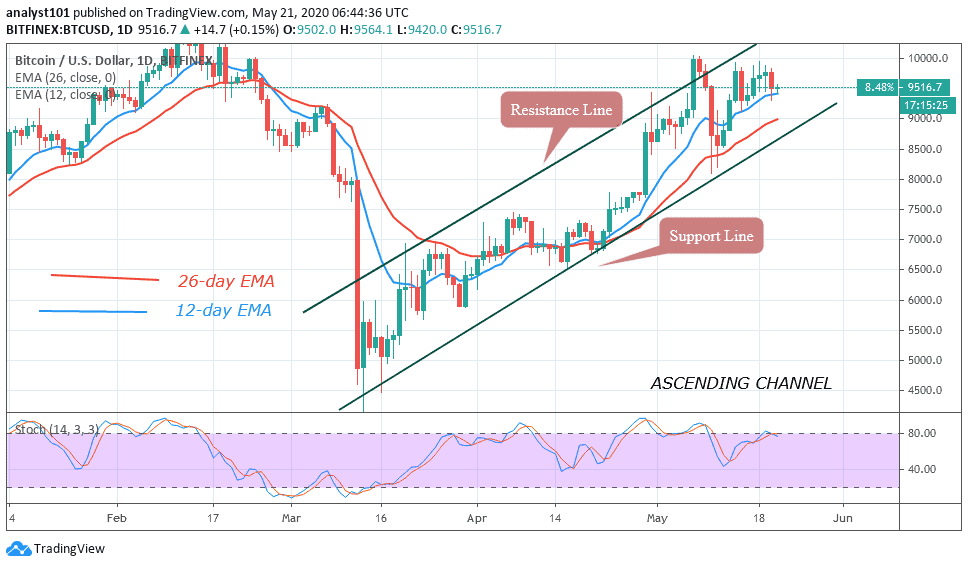
BTC/USD Long-term Trend: Bullish (Daily Chart)
Key levels:
Resistance Levels: $10,800, $11,000, $11,200
Support Levels: $8,500, $8,300, $8,100

BTC/USD is dropping below $9,500 during the early Asian hours of trading but the coin failed to recover above the critical level so far. At the time of writing, the price of Bitcoin is moving around $9,474 as the coin is down with 0.37%. The number one cryptocurrency hit a brick wall on the approach to $10,000 and dropped under the pivotal area within 2 days.
However, an upside break above the 9-day and 21-day moving averages around $9,700 is a must to start a substantial recovery. Meanwhile, the next hurdles may be seen near the resistance levels of $10,800, $11,000, and $11,200. On the downside, initial support is below the 21-day MA at $9,000 level and if there is a successful break below the support level of $8,800, the bears are likely to gain strength by bringing the price to a low of $8,500, $8,300 and $8,100 respectively.
Currently, Bitcoin price follows a dominant bearish bias and a glance at the technical indicator RSI (14) displays a negative picture for BTC in the near-term. In addition, maintaining a gradual downward trend in the negative region, the signal line of RSI (14) decreases as it faces a downward trend for an increase in selling entries.
BTC/USD Medium – Term Trend: Bearish (4H Chart)
Looking at the 4-hour chart, the bears are seen dominating the market tremendously, but the bulls are trying to defend the $9,200 support as well. Meanwhile, the $9,100 and below may come into play if BTC breaks below the mentioned support.
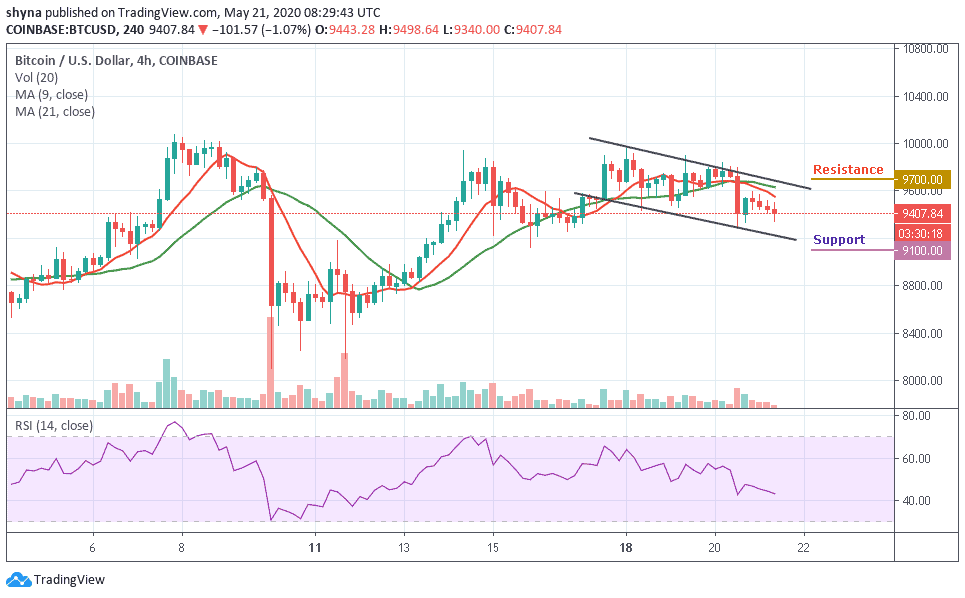
But if the buyers can reinforce and power the market, traders can expect a retest at $9,600 resistance level, and breaking this level may further allow the bulls to reach $9,700 and above. The RSI (14) crosses below the 45-level which indicates that more bearish signals may play out.
Please note: Insidebitcoins.com is not a financial advisor. Do your research before investing your funds in any financial asset or presented product or event. We are not responsible for your investing results.
Join Our Telegram channel to stay up to date on breaking news coverage